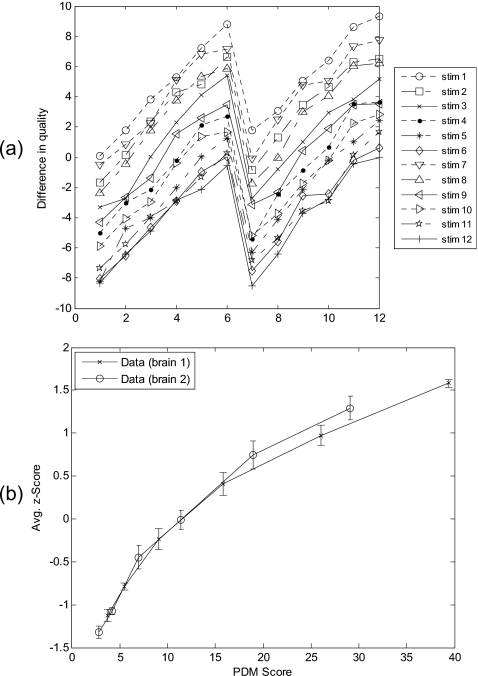
Figure 4.
Image quality evaluation with different raw brain images (brain slices 1 and 2) identical processing (GRAPPA reconstruction). Difference-in-quality scores, averaged over all subjects were shown in (a). The numbers 1–6 and 7–12 on the x axis correspond to brain slice 1 and brain slice 2, respectively. Each point on the curves indicates the score for the difference-in-quality between the corresponding row and column stimuli in the 12×12 stimulus matrix. Averaged subjective quality curves obtained by using Anderson’s FMT are shown in (b). Error bars represent standard deviations.

