Abstract
The purpose of this study was to propose and implement a computer aided detection (CADe) tool for breast tomosynthesis. This task was accomplished in two stages—a highly sensitive mass detector followed by a false positive (FP) reduction stage. Breast tomosynthesis data from 100 human subject cases were used, of which 25 subjects had one or more mass lesions and the rest were normal. For stage 1, filter parameters were optimized via a grid search. The CADe identified suspicious locations were reconstructed to yield 3D CADe volumes of interest. The first stage yielded a maximum sensitivity of 93% with 7.7 FPs∕breast volume. Unlike traditional CADe algorithms in which the second stage FP reduction is done via feature extraction and analysis, instead information theory principles were used with mutual information as a similarity metric. Three schemes were proposed, all using leave-one-case-out cross validation sampling. The three schemes, A, B, and C, differed in the composition of their knowledge base of regions of interest (ROIs). Scheme A’s knowledge base was comprised of all the mass and FP ROIs generated by the first stage of the algorithm. Scheme B had a knowledge base that contained information from mass ROIs and randomly extracted normal ROIs. Scheme C had information from three sources of information—masses, FPs, and normal ROIs. Also, performance was assessed as a function of the composition of the knowledge base in terms of the number of FP or normal ROIs needed by the system to reach optimal performance. The results indicated that the knowledge base needed no more than 20 times as many FPs and 30 times as many normal ROIs as masses to attain maximal performance. The best overall system performance was 85% sensitivity with 2.4 FPs per breast volume for scheme A, 3.6 FPs per breast volume for scheme B, and 3 FPs per breast volume for scheme C.
Keywords: computer aided detection, tomosynthesis, mass detection, projection images, reconstructed volume, information theory, mutual information, knowledge base, breast imaging, mammography, masses
INTRODUCTION
Mammography is currently the most effective early-detection tool for breast cancer screening. To provide a reliable and efficient second reader to aid breast-imaging radiologists, recent research has been directed towards developing computer-aided detection (CADe) tools for mammography.1, 2, 3, 4, 5, 6, 7, 8, 9, 10, 11, 12, 13, 14, 15, 16, 17 Although these tools have shown promise in identifying calcifications, detecting masses has proven relatively more difficult primarily due to presence of dense overlying tissue in a mammogram. Breast tomosynthesis has the potential to improve detection and characterization of breast masses by removing overlapping dense fibroglandular tissue. These systems provide 3D slice images from a modified full field digital mammography system which acquires a limited-angle cone beam CT scan under mammography positioning. Recent studies such as that by Poplack et al.18 demonstrated decreased recall rate and superior image quality for tomosynthesis versus conventional mammography. The goal of tomosynthesis to provide 3D information at comparable dose, resolution, and patient throughput to mammography, and with lower cost and hardware requirements compared to alternatives such as breast computed tomography or breast magnetic resonance imaging. However, with tomosynthesis, instead of the traditional four mammography views per case, the radiologist must interpret a large volume of data per breast volume. Given this constraint, the role of CADe is especially important in breast tomosynthesis. If this modality is ever intended to replace mammography as a screening tool, then a CADe algorithm that presents the radiologist with initial cues could potentially become indispensable to maintain current clinical workflow. In fact, investigators in CT colonography have already begun to show that CADe can potentially ease radiologist workflow with large 3D datasets.19
Previous CADe studies have reported CADe models for breast tomosynthesis. Reiser et al.20 have modified their 2D mammography algorithms to work with 3D tomosynthesis data. Their dataset consisted of 36 cases wherein 35 were biopsy proven malignant masses and 1 was benign. The training and testing set were the same, resulting in sensitivity of 90% with 1.5 false positives (FP) per breast volume.20 Chan et al.21 have combined information from 2D projection images with 3D volumes in 52 cases wherein 41 were malignant masses and 11 were benign. They reported sensitivities of 80% and 90% at an average FP rate of 1.2 and 2.3 per breast, respectively, while using a leave one out cross validation scheme. Comparable performances have been reported in other studies using smaller datasets.22, 23, 24
We propose to build a CADe scheme for tomosynthesis, incorporating unique preprocessing techniques and information theory methods. The CADe system in this study has two key components: (1) A highly sensitive mass detector, and (2) statistical models designed to reduce false positives. The “high-sensitivity, low specificity” stage of the proposed algorithm is the first component and is comprised of a Difference of Gaussians (DoG) filter. The second, “high-sensitivity, high-specificity” stage of the algorithm is comprised of false positive (FP) reduction using information theory principles. Previous 2D algorithms for mammograms that use information theory and similarity metrics to reduce false positives have shown that the ability of the system to optimally perform such a task is dependent on the nature of the “known” examples in the database available to it as the learning cases.25, 26 Therefore, further analysis is performed to identify the optimal knowledge base for our system. Three FP reduction schemes were evaluated that differ in the kind of information available for the task of false positive reduction. Finally, to explore if there are performance increases to be realized if more signal information was given to the system, two variants of the FP reduction system were compared—using only the central reconstructed slice of the CADe suspicious location versus using a summed slab of slices.
METHODS AND MATERIALS
Dataset
Our dataset was collected using a prototype breast tomosynthesis system Mammomat Novation TOMO (Caution: Investigational Device. Limited by U.S. Federal law to investigational use. The information about this product is preliminary. The product is under development and is not commercially available in the U.S.; and its future availability cannot be ensured.) by Siemens Medical Solutions (Erlangen, Germany), which acquires 25 projection images over a 50° angular range in approximately 13 s. The projection images are acquired using an amorphous selenium direct digital detector with a large surface area (24×30 cm) and with an 85 μm pixel pitch. Projection images of 2816×3584 pixels with 2×1 pixel binning in the tube motion direction are acquired by this system at the rate of two images∕s. Institutional review board approval was obtained, and informed consent was required and obtained for all subjects. This study was compliant with the Health Insurance Portability and Accountability Act. The protocol called for bilateral MLO views to be acquired in screening cases, while bilateral MLO and CC views were acquired for diagnostic and biopsy cases. An MQSA dedicated breast radiologist with over 15 years of experience interpreted these cases in blinded readings. The gold standard was established from information available from all modalities for a subject including mammography and, when available, ultrasound and MRI for nonbiopsied lesions, while biopsied lesions resulted in definitive histopathologic truth. One hundred human subject cases were used wherein there were 25 mass cases and 75 normal cases. All of these subjects were recruited at Duke University Medical Center in Durham, NC and had an average age of 57 years. Approximately 24% of the subjects had breast density of 25%, 20% were 50% dense, 46% were 75% dense and 10% were considered to have 100% dense breast; 83% of these subjects were Caucasian, 13% African-American and 4% identified themselves as either Hispanic or Asian. Due to some unilateral cases, a total of 192 scans were evaluated. The 25 mass cases contained 28 lesions of which ten were biopsy-proven malignant lesions and the rest were benign. Focal asymmetries and calcifications were excluded from this study. Average lesion size is approximately (100×100)±41 pixels or (8.5×8.5)±3.5 mms.
Overview of the CADe system
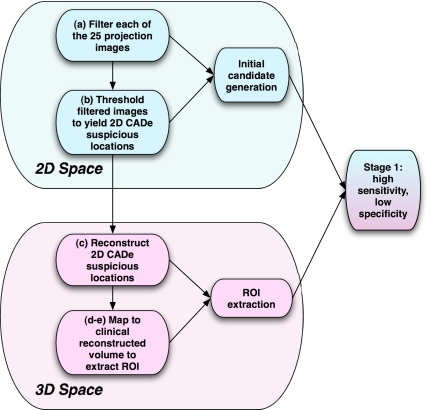
The CADe scheme is comprised of two distinct stages—the “high-sensitivity, low specificity” stage wherein regions of interests (ROIs) are extracted followed by the high-sensitivity, high-specificity stage that uses information theory principles to reduce false positives. We worked with the raw projection images with only standard detector preprocessing including dead pixel and uniformity correction. A schematic of the two stages can be seen in Figs. 13. The system performs the following steps:
-
a.
For each of the 25 projection images, the breast edge was detected by estimating an optimal threshold to distinguish the class distributions of the foreground and background pixels. Only information inside the breast boundary was preserved and was subsequently filtered.
-
b.
Threshold segmented, filtered projection images from step (a) to yield CADe suspicious locations in 2D.
-
c.
Reconstruct only the CADe suspicious locations generated by step (b) via shift and add reconstruction method to yield 3D volumes of CADe suspicious locations.27
-
d.
Locate the center of the CADe reconstructed suspicious locations in 3D and map to the filtered backprojection (FBP) 3D reconstructed volume used during radiologist interpretation.
-
e.
Extract ROIs from FBP reconstructed slices at the locations specified in step (d).
-
f.
Implement various FP reduction schemes to attain final system performances.
Figure 1.
Stage 1—the filtration and ROI extraction or the high-sensitivity, low specificity stage of the CADe algorithm.
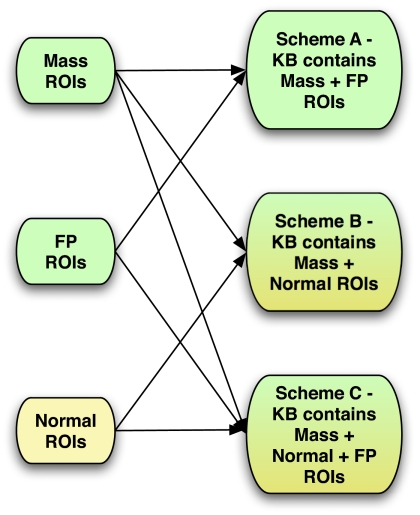
Figure 3.
Composition of knowledge base of false positive reduction stage of the CADe algorithm (a) scheme “A” KB composition (b) schemes “A” and “B” composition.
Stage 1—Filtration and ROI extraction
For each breast view, the 25 projection images were filtered using a Difference of Gaussians (DoG) filter.28, 29, 30 The DoG filter in two dimensions is achieved by subtracting a rotationally symmetric, two-dimensional Gaussian with width parameter σ1 from another rotationally symmetric, two-dimensional Gaussian with width parameter σ2. Mathematically, the filter template w is defined as
| (1) |
where
| (2) |
where r is the distance to the origin and σi is the constituent width parameter of the filter template. Of note here is the relationship between the two standard deviations where σ1<σ2.
Each of the filtered projection images was then subjected to adaptive thresholding to yield CADe suspicious locations in each of the projections. In that process, the thresholds for each of the projection images were dynamically selected by starting with the top 10% of the pixel values of the filtered projection image resulting in an initial set of CADe suspicious locations. Further drops in the threshold resulted in either an increase in the area of the initial suspicious locations or in the formation of new ones. The threshold was thus dropped as low as possible without merging together any two suspicious locations. For dense breasts, this threshold often included approximately 15% of the top pixel values, while for fatty breasts the thresholds were generally selected at about 25% of the top pixel values. Only the segmented 2D projection images thus obtained were shifted and added using the acquisition angle and known geometry to yield 3D locations of the volume of interest (VOI) of just the CADe locations.31
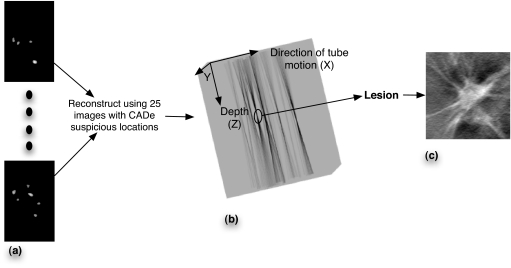
A 3×3×3 connectivity rule was used to yield CADe suspicious locations in 3D space making it possible to determine location and shape of the object of interest. Specifically, every pixel in each of the slices of the reconstructed slices of the CADe suspicious locations was assigned to a VOI using its proximity to a cluster of pixels. This resulted in a set of VOIs for every scanned breast view. Since the shift and add reconstruction algorithm did not have any measures in its implementation to prevent out of plane blur, the resulting reconstructed CADe suspicious volumes from the first stage had significant blur in planes other than where the centroid of the volume of interest lies, resulting in a starburst shape wherein the true object lies in the plane where the contributions from all the projection images come into focus. Thus, it is assumed that a mass came into focus in the plane with the least cross-sectional area of the volume obtained after reconstruction. False positives due to overlapping tissue in just a few projection images should result in weaker 3D reinforcement of signals. An example of such a reconstruction is shown in Fig. 2. This 3D location of the volume of interest was then compared to the radiologist-determined ground truth to determine if a given CADe location is a true positive or a false positive. To determine whether a CADe suspicious location is indeed a true positive, the following rule was used:
where A(CADe) is the area of the CADe location, and A(Truth) is the area of the truth location.
Figure 2.
(a) 25 CADe suspicious locations in 2D for subject 33 (b). Reconstructed CADe suspicious locations using the images in “a.” Significant out of plane blur is observed in Z direction. (c) A 256×256 ROI centered at the X,Y location at the depth with the sharpest focus is extracted from the FBP reconstructed volumes and shown in “b.”
The optimization of the first high-sensitivity, low-specificity stage of the algorithm was done using all available cases, as there were not enough mass cases in our database to establish separate reasonably sized testing and training sets. The figure of merit was the maximum sensitivities as a function of the two DoG parameters, σ1 and σ2. For the lesions in our database, the average size is approximately 100×100 pixels (8.5×8.5 mm). A search was therefore performed wherein the filter parameters were varied from 32 to 152 pixels (2.7–12.92 mm) to bracket that size.
Once the algorithm had identified initial candidates for mass detection by giving the X, Y, and Z location of the centroid of the volume of interest, regions of interest (ROIs) were extracted from the reconstructed breast slice images obtained by filtered backprojection (FBP) which yielded 1-mm-thick slices with 85×85 μm pixel pitch.32, 33 Also shown in Fig. 2 is the corresponding lesion ROI that was extracted from the FBP reconstructed volume. The FP reduction scheme therefore was based upon the same reconstructed image data as used by radiologists. Two sets of ROIs were extracted to assess the effect of information from one versus many slices. In the first set, 256×256 pixel ROIs (22×22 mm) centered at the central slice containing the suspicious CADe location were extracted. For the second set, 256×256 ROIs representing the summed slab of five slices (5 mm) were extracted. Since lesions typically span multiple reconstructed slices, these two sets investigated whether giving more “signal” to the false positive reduction scheme resulted in an improvement in performance. Use of a slab would also reduce the impact of slight errors of localization in the Z direction.
Stage 2—False positive reduction
Information theory principles were used to reduce false positives (FPs) in the second stage of the algorithm. The fundamental quantities of information theory are entropy and relative entropy. For any probability distribution, entropy is defined as a quantity that follows an intuitive notion of a measure of information. In other words, entropy, among other measures such as variance etc., is a way to quantify the uncertainty involved in a random variable. This notion is extended to define “mutual information” which is a measure of the amount of information one random variable contains about another. Hence, mutual information is a reduction in the uncertainty of one random variable due to the knowledge gleaned from observing the other random variable. Mathematically, it is given by the following relation:34
| (3) |
where X and Y are two random variables, p(x,y) is their joint probability mass function because this is a discrete rather than continuous random variable, and p(x) and p(y) are the marginal probability mass functions of X and Y.
Traditionally CADe schemes measure, among others, morphological and texture features of a suspicious location for subsequent false positive reduction using trainable classifiers. Research has been done by Suzuki et al.35, 36, 37, 38 toward alternative approaches to FP reduction by using massive training artificial neural networks. This study used mutual information as a similarity metric for false positive reduction that relies completely on the statistical properties of the image histograms and the relationship between pixels of an image. Furthermore, information theoretic similarity measures make no assumptions about the underlying image distributions, which may be advantageous given the relatively small number of lesions in our dataset. The theoretical approach adopted in this study has been presented previously39, 40, 41 for 2D mammograms. This study extended the concept for 3D reconstructed slices and slabs.
An information theory based system compares an unknown query ROI to every ROI in its “knowledge base” (KB) using a similarity metric such as mutual information. Similarity metrics are then combined using a decision index41 given in Eq. 4
| (4) |
where Q is the query ROI, MI(⋅,⋅) is the mutual information between the query Q and the ROI in the KB. Mj and Nj are the jth mass and normal ROI, respectively, in a KB that contains a total of m mass and n normal ROIs. By applying various thresholds on these indices for all cases in the database the performance can be studied as a receiver operating characteristic (ROC) curve. Both area under curve (AUC) and partial area under curve (pAUC) above 90% sensitivity were measured nonparametrically.42, 43 To estimate the two-sided p value for the central slice versus sum of adjacent slices datasets for each scheme, a set of cases was bootstrapped to estimate the difference in performance. This was repeated to obtain an estimate of the difference distribution.
The performance of an information theory based system is dependent on the composition of the knowledge base. The first stage of the algorithm generates ROIs that are either mass lesions or FPs. Of note here is the imbalance in the number of lesion ROIs when compared to the total number of FPs generated by the first stage. Given this imbalance, it is imperative to explore the effect of knowledge about normal breast parenchyma represented by those FPs. This was studied in two ways. First, an increasing number of FPs was sampled from all FPs available while holding the number of true positives constant, thus decreasing the ratio of mass ROIs in the KB and progressively giving the system more indirect “knowledge” of normal breast parenchyma. The second approach is to provide the system with direct information about normal breast parenchyma via randomly selected normal ROIs instead of suspicious FP regions generated by a CADe algorithm. Since these ROIs were extracted from random locations from within the breast volume there is a potential for some overlap with FPs generated by the first stage of the algorithm. Varying the number of mass ROIs in the knowledge base can also change composition of the knowledge base. However, given that our database consists of a limited number of mass ROIs, its effect was not studied in this experiment.
Three schemes were therefore developed to investigate the optimal ratio of normal and false positive ROIs in the knowledge base, as shown in Fig. 3. In scheme A, FP reduction was done using a KB containing ROIs from the CADe algorithm’s first stage. These ROIs were either mass ROIs or FPs. In scheme B, the KB contained only mass ROIs and randomly selected normal ROIs from well-separated depths in all the normal cases’ reconstructed volumes. A total of 1390 such normal ROIs were extracted for this study. To access performance of the scheme A classifier, a leave-one-case-out validation scheme was used. Thus, for every ROI that was presented to the system as a query ROI of unknown pathology, all other ROIs generated from that specific subject’s reconstructed volumes were excluded from the KB. For scheme B, all the FPs of the first stage of the algorithm served as queries to the system to assess its specificity. Sensitivity for scheme B was evaluated using a leave-one-case -out sampling scheme on all available ROIs that contained a mass. Thus the system has no knowledge of FP ROIs in its KB and hence the performance is not dependent on the nature of FP lesions generated by the first stage of the algorithm. Finally, scheme C included information from all three sources: (1) Masses (2) CADe generated FPs (3) normal breast tissue, combined into a single KB. Analysis was done in a leave-one-case-out manner for this KB as well. In the end, the scores for all ROIs thus obtained from various schemes were then combined using the decision index given by Eq. 4.
RESULTS
Optimization of stage 1
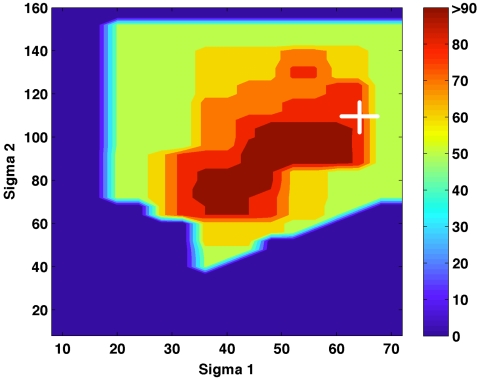
Optimization of the first high-sensitivity, low-specificity stage of the algorithm involved a grid search over the 2 DoG parameters, σ1 and σ2. Maximum sensitivity for each combination is shown in Fig. 4. The parameter sets that were not explored are represented with a zero percent sensitivity. While the FP rate for each parameter set was recorded, no specific optimization for the FP rate was performed. There were two distinct areas with high reported sensitivities, centered at σ1 and σ2 pairs of 40∕72 (3.4∕6.12 mm) and 56∕96 pixels (4.76∕8.16 mm) with 9.3 and 7.7 FPs∕breast volume, respectively. The parameters 56∕96 yielded fewer false positives and were therefore picked for further analysis of stage 2. Thus, the first stage of the algorithm yielded a maximum sensitivity of 93% and 1472 FPs resulting in a FP rate of 7.7 FPs per breast volume. All available cases were used for the optimization of this stage due to the small size of the dataset resulting in the possibility of a positive bias in the reported performance of the proposed algorithm.
Figure 4.
Sensitivity as a function of the two filter parameters for stage 1 of the algorithm. The combination marked by the “+” was chosen, yielding 93% sensitivity with 7.7 FPs∕breast volume.
Optimization of the FP reduction stage
Scheme A—effect of FP ROIs in the KB
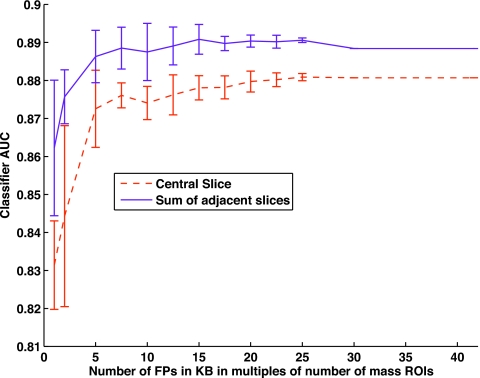
Scheme A seeks to differentiate between a mass and a FP query. A plot of the ROC AUC as a function of increasing number of FPs is presented in Fig. 5, where the x axis shows number of FPs as multiples of the total number of mass ROIs while using the scheme A classifier. The error bars are obtained by simple random sampling25, 44 from all the available FPs of the first stage. Twenty subsets of the FP ROIs were generated for each data point on the graph. Each subset was selected without replacement after randomization between subsets. When the sum of adjacent slices was used, as the number of FPs was increased the performance increased. When there were 20 times as many FPs as mass ROIs, the system reached a sensitivity of 89%. Adding more FP ROIs no longer improved the performance. A similar trend was observed while using only the central slice of the VOI with a maximum sensitivity of 88%. Addition of more FP ROIs after a ratio of 25 times that of the masses again does not improve performance. It should be noted that as the number of multiples of FP in the KB increases, the error bars in Fig. 5 will also decrease because of increasing overlap in selected FP ROIs for each draw.
Figure 5.
The figure of merit, ROC AUC, is plotted as a function of increasing number of FP ROIs in the system.
Scheme B—effect of normal ROIs in the KB
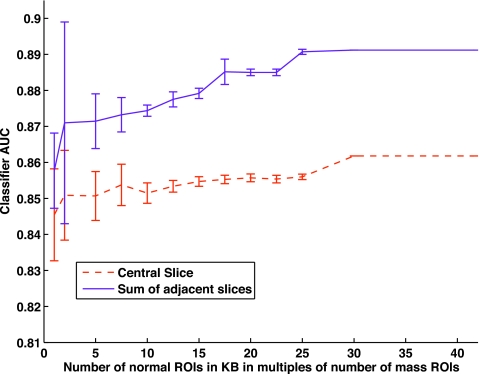
Scheme B assessed the behavior of the system with the presence of normal ROIs in the KB. Figure 6 depicts this trend as a function of increasing number of normal ROIs in the system. As previously described in Sec. 3B1, the error bars are obtained when the same data point of the graph is evaluated using 20 different subsets of the normal ROIs available. AUC increased as more normal ROIs were added to the KB and levels off at a ratio of 25 times as many normals as masses for sum of adjacent slices. The same leveling off in performance for central slice was seen with 30 times as many normals as mass ROIs. Performance was comparable to that of scheme A. Scheme B attained a maximum classifier AUC of 86% for central slice ROIs and 89% for sum of slices ROIs. As with scheme A, use of the slab ROIs did not affect performance substantially, although here in scheme B it had a more noticeable increase in performance than for scheme A.
Figure 6.
The figure of merit, ROC AUC is plotted as a function of increasing number of normal ROIs in the system.
Classifier performances
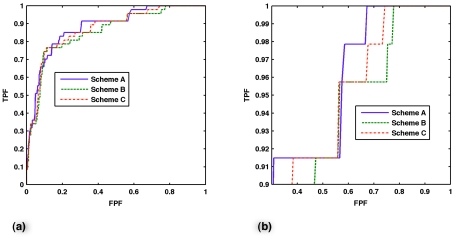
Table 1 presents overall classifier performance for all schemes. As implemented, summing adjacent slices did not improve the classifier performance in a statistically significant way compared to using only the single, central slice ROI for any of the schemes evaluated, either for AUC or partial AUC. Shown in Fig. 7 are the ROCs and partial ROCs of just the central slice classifiers of all schemes.
Table 1.
Classifier performance for a KB containing mass and FP ROls (scheme A), mass and normal ROls (scheme B) and when the KB contains ROls from all 3 sources—mass, FP and normal ROls (scheme C). The AUC and pAUC for both the central slice and the sum of adjacent slices and their corresponding p values for all schemes is shown.
| Scheme | Central slice only | Sum of adjacent slices | p value | |||
|---|---|---|---|---|---|---|
| AUC | pAUC | AUC | pAUC | AUC | pAUC | |
| A | 0.88±0.02 | 0.49±0.09 | 0.89±0.03 | 0.46±0.10 | 0.3 | 0.2 |
| B | 0.86±0.03 | 0.41±0.09 | 0.89±0.03 | 0.36±0.10 | 0.5 | 0.2 |
| C | 0.87±0.02 | 0.45±0.09 | 0.88±0.03 | 0.41±0.10 | 0.43 | 0.19 |
Figure 7.
(a) Nonparametric ROC curves of the central slice classifier for schemes A, B, and C. (b) Partial ROC curves for sensitivity greater than 0.9 for the three schemes.
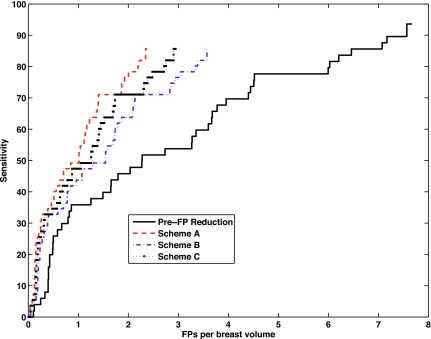
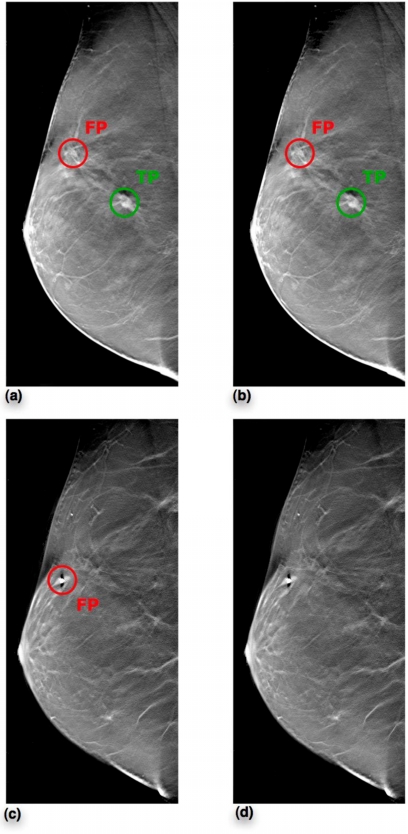
Sensitivity when plotted as a function of the average FP rate while the decision threshold is varied results in the Free-Response Receiver Operating Characteristic (FROC) curve. Figure 8 shows the system FROCs prior to FP reduction as well as after FP reduction for schemes A, B, and C. These were obtained by varying the decision threshold over classifier outputs of the central slice classifiers of the three schemes starting with a threshold set at 91.5% sensitivity. For each scheme, the threshold was then progressively dropped to obtain the entire curve. Scheme A outperformed others in terms of FPs per breast volume at equivalent sensitivity. At an operating point of 91.5%, scheme A was successfully able to discard 69% of the FPs per breast volume, scheme B correctly eliminated 53% of the FPs per breast volume, and last, scheme C was able to correctly discard 62% of the FPs per breast volume. The final performances were a sensitivity of 85% at 2.4 FPs per breast volume, 3.6 FPs per breast volume, and 3 FPs per breast volume for schemes A, B, and C, respectively. The Jackknife Free-Response Receiver Operating Characteristic (JAFROC)45 was used to evaluate these FROC curves. None of the differences between the FROC curves of the three schemes studied were statistically significant. A human subject example from subject 122 is shown in Fig. 9. While this subject had 5 FPs in total only two reconstructed slices containing 1 TP and 2 FPs are shown for illustration purposes. These results were obtained when the CADe algorithm with a scheme A central slice classifier is used while operating at 91.5% sensitivity. After FP reduction, the FP in slice 40 was eliminated, however one FP along with the TP survived in slice 36. This subject had biopsy confirmed cancer.
Figure 8.
System FROCs. Prior to FP reduction, the system performance was at 93% sensitivity with 7.7 FPs per breast volume. Final system performances for the three schemes are depicted for the central slice classifiers.
Figure 9.
(a) Slice 41 prior to FP reduction, (b) Slice 41 after FP reduction, (c) Slice 21 prior to FP reduction, (d) Slice 21 after FP reduction. Subject 122 had biopsy confirmed carcinoma. While this subject had 6 FPs in total from stage 1 of the CADe algorithm, only reconstructed slices 41 and 21 are shown in this figure for illustration. After setting the threshold for scheme A central slice classifier to operate at 91.5% sensitivity, we are able to eliminate the FP in slice 21. However, the FP in slice 41 survives along with the TP.
DISCUSSION
Several CADe algorithms exist for breast tomosynthesis data in current literature. All published tomosynthesis CADe algorithms used some form of feature extraction scheme for the FP reduction stage. This study was unique in that it utilized information theory principles for this task. Given this relatively small dataset, the model still provided generalizable results when using scheme B. The generalizability here refers only to the fact that scheme B performance is independent of the nature of FPs generated by the first stage of our specific algorithm. The performance of schemes A and C can be influenced by the nature of FPs generated by other filters or another first stage of a CADe algorithm, whereas that of scheme B is independent of the kind of FPs. Additional information about mass cases would merely enhance system performance over datasets that include subjects from other geographical locations, patient populations, etc. This is because inclusion of more mass cases will help the system obtain more accurate “knowledge” of the various kinds of mass cases. A larger, more varied KB will have at least representative examples from all the major lesion types and will better capture the variations of various lesions.
As the amount of data available increases, an understanding of what constitutes an optimal KB in terms of the optimal number of FPs and∕or normals will become pivotal for all practical applications. This is because similarity metrics need to be calculated for each query presented to the system with every ROI in the database. If there is nothing to be gained in terms of performance, then having more ROIs in the database simply adds to time needed for the system to generate CADe marks on a new case. To better understand the composition of such an optimal KB for tomosynthesis data, three FP reduction schemes were compared, each based on ROIs from only a single central slice versus a summed slab of slices from the first stage of the algorithm. While doing so, several trends were observed. There was no statistically significant difference in classifier performance when comparing the use of a single, central slice only versus the sum of adjacent slices, regardless of whether the AUC or partial AUC was the figure of merit. Scheme B’s performance was almost the same as that of A and C, even though B does not use FPs in its KB. The performance of scheme B was independent of the nature of FPs generated by the first stage of the algorithm. JAFROC analyses of the system performances for the three schemes also indicate that there is no statistically significant difference between scheme B when compared against scheme A and C. Thus the results obtained for scheme B may be more robust when given either different cases or another set of unknown ROIs from these same cases that contain false positives generated by a different filter or algorithm. The performance of scheme C was between that of A and B as it added the use of FPs in its KB.
The study of the optimal balance between positive and negative cases in the KB also yielded several interesting trends. For scheme A, the system reached its maximum performance with a FP ratio of 20 times that of mass ROIs in its KB. A similar trend was observed in scheme B when the KB contained information about only masses and normal breast tissue where nearly 30 times as many normal ROIs were needed in the KB as mass ROIs. Thus it appeared that scheme B required more examples of randomly extracted normal ROIs compared to scheme A which used more suspicious normal anatomy presented in FP ROIs. Regardless of the nature of the negative, nonmass cases, both systems showed that when given an increasingly larger number of nonmass ROIs in its KB, their performance increased toward an asymptote. Furthermore, we found that more nonmass ROIs than mass ROIs were needed in order for the algorithm to learn the naturally greater variability of normal breast anatomy. Both schemes displayed larger standard deviations in performance levels initially with tighter confidence levels attained as the schemes were given increasing information about the diversity of normal breast tissue.
Estimates of the least number of FPs or normal ROIs needed to obtain maximal performance can potentially change when more mass ROIs are added to the KB. However, a study of what that optimal number is with the current size of the dataset has lead us to the understanding that fewer FPs and normal ROIs in the KB result in greater variability in performance, and that there indeed exists a minimal ratio of these ROIs to the number of mass ROIs in the KB to attain maximal performance. Therefore, while such a ratio is likely to change with additional mass cases, there are two important conclusions to be drawn from these results.
These results of experiments to study optimal knowledge base composition show that for the current CADe system it is possible to attain maximal performance with little over half the number of ROIs in virtually all the three schemes. This is significant as it implies an appreciable improvement in the computational efficiency of the algorithm. The total processing time for the second stage of this algorithm that uses a LOO CV scheme is N2∕2. A reduction in the number of ROIs in the knowledge base by half would imply an improvement of a factor of 4 in overall computational efficiency. However, in a clinical setting the computational efficiency needs to be looked at from the point of view of a single breast volume being examined. The first stage of the algorithm generates approximately eight CADe marks per breast view. When using a Linux Intel 2.6 GHz dual-core dual-processor system, it takes about 1 s for the system to come up with an average MI score for a single query ROI when compared against our entire knowledge base. This implies a processing time of about 2 s to come up with each of the two terms for Eq. 4 for every CADe mark from the first stage, and hence about 16 s to process the entire breast volume with eight such potential locations generated by the first stage of the algorithm. Reduction in the knowledge base of half would imply a computational reduction of half, i.e., 8 s in a clinical setting.
There were limitations to this study. More cases with lesions should be added to capture the diversity of breast masses. Because of the relatively small size of available dataset, the optimization of the initial filtering stage was done using all available cases with some resulting possibility of bias; addition of new cases could potentially imply a different optimal filter parameter set. The decision to sum five adjacent slices was based on the observation that most lesions spanned a space of at least 5 mm. Improvements in performance due to variation of this parameter in the algorithm has not been investigated in this study. Last, studies remain to be done in improving system performance by studying other similarity metrics and ROI sizes.
CONCLUSION
A CADe system for breast tomosynthesis was developed which attained promising results over a dataset of 100 human subjects consisting of 25 mass cases. The best overall system performance was achieved while using a knowledge base consisting of mass and false positive ROIs. Adding normal ROIs in addition to or in place of the false positives resulted in the same sensitivity but slightly worse specificity, but may represent more generalizable results as doing so decreased the dependence on specifics of this detection algorithm. In conclusion, this CADe system was based on a human subject data set and used an innovative false positive reduction scheme of featureless information theory based similarity metrics, and demonstrated promising results for mass lesion detection.
ACKNOWLEDGMENTS
This work has been supported in part by Grant Nos. NIH∕NCI R01 CA112437 and R01 CA101911, U.S. Army Breast Cancer Research Program W81XWH-05-1-0293, and a research agreement with Siemens Medical Solutions. The authors would like to thank Thomas Mertelmeier and Jasmina Ludwig of Siemens Medical Solutions for development of the FBP reconstruction software and helpful suggestions. Also, the authors thank the radiologists of the division of breast imaging of Duke University Medical Center for interpreting the tomosynthesis reconstructed volumes. The authors would like to extend special thanks to Brian Harrawood for his support in scientific programming for this study.
References
- Wu Y.-T., Wei J., Hadjiiski L. M., Sahiner B., Zhou C., Ge J., Shi J., Zhang Y., and Chan H.-P., “Bilateral analysis based false positive reduction for computer-aided mass detection,” Med. Phys. 10.1118/1.2756612 34, 3334–3344 (2007). [DOI] [PMC free article] [PubMed] [Google Scholar]
- Wei J., Chan H.-P., Sahiner B., Hadjiiski L. M., Helvie M. A., Roubidoux M. A., Zhou C., and Ge J., “Dual system approach to computer-aided detection of breast masses on mammograms,” Med. Phys. 10.1118/1.2357838 33, 4157–4168 (2006). [DOI] [PMC free article] [PubMed] [Google Scholar]
- Sahiner B., Chan H.-P., Hadjiiski L. M., Helvie M. A., Paramagul C., Ge J., Wei J., and Zhou C., “Joint two-view information for computerized detection of microcalcifications on mammograms,” Med. Phys. 10.1118/1.2208919 33, 2574–2585 (2006). [DOI] [PMC free article] [PubMed] [Google Scholar]
- Wei J., Sahiner B., Hadjiiski L. M., Chan H.-P., Petrick N., Helvie M. A., Roubidoux M. A., Ge J., and Zhou C., “Computer-aided detection of breast masses on full field digital mammograms,” Med. Phys. 10.1118/1.1997327 32, 2827–2838 (2005). [DOI] [PMC free article] [PubMed] [Google Scholar]
- Paquerault S., Petrick N., Chan H. P., Sahiner B., and Helvie M. A., “Improvement of computerized mass detection on mammograms: Fusion of two-view information,” Med. Phys. 10.1118/1.1446098 29, 238–247 (2002). [DOI] [PubMed] [Google Scholar]
- Qian W., Li L., and Clarke L. P., “Image feature extraction for mass detection in digital mammography: Influence of wavelet analysis,” Med. Phys. 10.1118/1.598531 26, 402–408 (1999). [DOI] [Google Scholar]
- Yu S. and Guan L., “A CAD system for the automatic detection of clustered microcalcifications in digitized mammogram films,” IEEE Trans. Med. Imaging 10.1109/42.836371 19, 115–126 (2000). [DOI] [PubMed] [Google Scholar]
- Schmidt F., Sorantin E., Szepesvari C., Graif E., Becker M., Mayer H., and Hartwagner K., “An automatic method for the identification and interpretation of clustered microcalcifications in mammograms,” Phys. Med. Biol. 10.1088/0031-9155/44/5/011 44, 1231–1243 (1999). [DOI] [PubMed] [Google Scholar]
- Huo Z., Giger M. L., Vyborny C. J., Wolverton D. E., and Metz C. E., “Computerized classification of benign and malignant masses on digitized mammograms: A study of robustness,” Acad. Radiol. 7, 1077–1084 (2000). [DOI] [PubMed] [Google Scholar]
- D. M.Catarious, Jr., Baydush A. H., and C. E.Floyd, Jr., “Incorporation of an iterative, linear segmentation routine into a mammographic mass CAD system,” Med. Phys. 10.1118/1.1738960 31, 1512–1520 (2004). [DOI] [PubMed] [Google Scholar]
- Zheng B., Chang Y. H., Wang X. H., Good W. F., and Gur D., “Feature selection for computerized mass detection in digitized mammograms by using a genetic algorithm,” Acad. Radiol. 6, 327–332 (1999). [DOI] [PubMed] [Google Scholar]
- Chan H. P., Sahiner B., Lam K. L., Petrick N., Helvie M. A., Goodsitt M. M., and Adler D. D., “Computerized analysis of mammographic microcalcifications in morphological and texture feature spaces,” Med. Phys. 10.1118/1.598389 25, 2007–2019 (1998). [DOI] [PubMed] [Google Scholar]
- Gavrielides M. A., Lo J. Y., Vargas-Voracek R., and C. E.Floyd, Jr., “Segmentation of suspicious clustered microcalcifications in mammograms,” Med. Phys. 10.1118/1.598852 27, 13–22 (2000). [DOI] [PubMed] [Google Scholar]
- Ge J., Sahiner B., Hadjiiski L. M., Chan H.-P., Wei J., Helvie M. A., and Zhou C., “Computer aided detection of clusters of microcalcifications on full field digital mammograms,” Med. Phys. 10.1118/1.2211710 33, 2975–2988 (2006). [DOI] [PubMed] [Google Scholar]
- Li L., Zheng Y., Zheng L., and Clark R. A., “False-positive reduction in CAD mass detection using a competitive classification strategy,” Med. Phys. 10.1118/1.1344203 28, 250–258 (2001). [DOI] [PubMed] [Google Scholar]
- Sahiner B., Chan H.-P., Petrick N., Helvie M. A., and Hadjiiski L. M., “Improvement of mammographic mass characterization using spiculation measures and morphological features,” Med. Phys. 10.1118/1.1381548 28, 1455–1465 (2001). [DOI] [PubMed] [Google Scholar]
- Singh S., Baydush A. H., Harrawood B., and Lo J. Y., “Mass detection in mammographic ROIs using Watson filters,” SPIE Medical Imaging 2006: Image Perception, Observer Performance, and Technology Assessment, San Diego, CA, Vol. 6146, 2006.
- Poplack S. P., Tosteson T. D., Kogel C. A., and Nagy H. M., “Digital breast tomosynthesis: Initial experience in 98 women with abnormal digital screening mammography,” AJR, Am. J. Roentgenol. 10.2214/AJR.07.2231 189, 616–623 (2007). [DOI] [PubMed] [Google Scholar]
- Abraham H. D. and Hiro Y., “Virtual colonoscopy: Past, present, and future,” Radiol. Clin. North Am. 41, 377–393 (2003). [DOI] [PubMed] [Google Scholar]
- Reiser I., Nishikawa R. M., Giger M. L., Wu T., Rafferty E. A., Moore R., and Kopans D. B., “Computerized mass detection for digital breast tomosynthesis directly from the projection images,” Med. Phys. 10.1118/1.2163390 33, 482–491 (2006). [DOI] [PubMed] [Google Scholar]
- Chan H.-P., Wei J., Zhang Y., Moore R. H., Kopans D. B., Hadjiiski L., Sahiner B., Roubidoux M. A., and Helvie M. A., “Computer-aided detection of masses in digital tomosynthesis mammography: Combination of 3D and 2D detection information,” Medical Imaging 2007: Computer-Aided Diagnosis, San Diego, CA, Vol. 6514, pp. 651416–651416, 2007.
- Peters G., Muller S., Bernard S., Iordache R., and Bloch I., “Reconstruction-independent 3D CAD for mass detection in digital breast tomosynthesis using fuzzy particles,” Medical Imaging 2006: Image Processing, San Diego, CA, Vol. 6144, pp. 61441Z–61410, 2006.
- Chan H. P., Wei J., Sahiner B., Rafferty E. A., Wu T., Roubidoux M. A., Moore R. H., Kopans D. B., Hadjiiski L. M., and Helvie M. A., “Computer-aided detection system for breast masses on digital tomosynthesis mammograms: Preliminary experience,” Radiology 237, 1075–1080 (2005). [DOI] [PMC free article] [PubMed] [Google Scholar]
- Singh S., Tourassi G. D., and Lo J. Y., “Breast mass detection in tomosynthesis projection images using information-theoretic similarity measures,” SPIE Medical Imaging 2007: Computer-Aided Diagnosis, San Diego, CA, Vol. 6513, 2007.
- Tourassi G. D. and C. E.Floyd, Jr., “Knowledge-based detection of mammographic masses: Analysis of the impact of database comprehensiveness,” Medical Imaging 2005: PACS and Imaging Informatics, San Diego, CA, Vol. 5748, pp. 399–406, 2005.
- Tourassi G. D., Harrawood B., Singh S., and Lo J. Y., “Information-theoretic CAD system in mammography: Entropy-based indexing for computational efficiency and robust performance,” Med. Phys. 10.1118/1.2751075 34, 3193–3204 (2007). [DOI] [PubMed] [Google Scholar]
- Samei E., Stebbins S. A., J. T.Dobbins, III, and Lo J. Y., “Multiprojection correlation imaging for improved detection of pulmonary nodules,” AJR, Am. J. Roentgenol. 10.2214/AJR.06.0843 188, 1239–1245 (2007). [DOI] [PubMed] [Google Scholar]
- Zheng B., Chang Y. H., and Gur D., “Computerized detection of masses in digitized mammograms using single-image segmentation and a multilayer topographic feature analysis,” Acad. Radiol. 2, 959–966 (1995). [DOI] [PubMed] [Google Scholar]
- Zheng B., Chang Y. H., and Gur D., “Adaptive computer-aided diagnosis scheme of digitized mammograms,” Acad. Radiol. 3, 806–814 (1996). [DOI] [PubMed] [Google Scholar]
- Polakowski W. E., Cournoyer D. A., Rogers S. K., DeSimio M. P., Ruck D. W., Hoffmeister J. W., and Raines R. A., “Computer-aided breast cancer detection and diagnosis of masses using difference of Gaussians and derivative-based feature saliency,” IEEE Trans. Med. Imaging 10.1109/42.650877 16, 811–819 (1997). [DOI] [PubMed] [Google Scholar]
- Chen Y., Dobbins J. T., and Lo J. Y., “Importance of point-by-point back projection correction for isocentric motion in digital breast tomosynthesis: Relevance to morphology of structures such as microcalcifications,” Med. Phys. 10.1118/1.2776256 34, 3885–3892 (2007). [DOI] [PubMed] [Google Scholar]
- Bissonnette M., Hansroul M., Masson E., Savard S., Cadieux S., Warmoes P., Gravel D., Agopyan J., Polischuk B., Haerer W., Mertelmeier T., Lo J. Y., Chen Y., J. T.DobbinsIII, Jesneck J. L., and Singh S., “Digital breast tomosynthesis using an amorphous selenium flat panel detector,” Medical Imaging 2005: Physics of Medical Imaging, San Diego, CA, Vol. 5745, pp. 529–540, 2005.
- Mertelmeier T., Orman J., Haerer W., and Dudam M. K., “Optimizing filtered backprojection reconstruction for a breast tomosynthesis prototype device,” Medical Imaging 2006: Physics of Medical Imaging, San Diego, CA, Vol. 6142, pp. 61420F–61412, 2006.
- Cover T. and Thomas J., Elements of Information Theory (Wiley-Interscience, New York, 1991). [Google Scholar]
- Suzuki K., S. G.Armato, 3rd, Li F., Sone S., and Doi K., “Massive training artificial neural network (MTANN) for reduction of false positives in computerized detection of lung nodules in low-dose computed tomography,” Med. Phys. 10.1118/1.1580485 30, 1602–1617 (2003). [DOI] [PubMed] [Google Scholar]
- Suzuki K., Yoshida H., Nappi J., and Dachman A. H., “Massive-training artificial neural network (MTANN) for reduction of false positives in computer-aided detection of polyps: Suppression of rectal tubes,” Med. Phys. 10.1118/1.2349839 33, 3814–3824 (2006). [DOI] [PubMed] [Google Scholar]
- Suzuki K., Shiraishi J., Abe H., MacMahon H., and Doi K., “False-positive reduction in computer-aided diagnostic scheme for detecting nodules in chest radiographs by means of massive training artificial neural network1,” Acad. Radiol. 12, 191–201 (2005). [DOI] [PubMed] [Google Scholar]
- Suzuki K., Suzuki K., Feng L., Sone S., and Doi K. A. D. K., “Computer-aided diagnostic scheme for distinction between benign and malignant nodules in thoracic low-dose CT by use of massive training artificial neural network,” IEEE Trans. Med. Imaging 10.1109/TMI.2005.852048 24, 1138–1150 (2005). [DOI] [PubMed] [Google Scholar]
- Tourassi G. D., Harrawood B., Singh S., Lo J. Y., and C. E.Floyd, Jr., “Evaluation of information-theoretic similarity measures for content-based retrieval and detection of masses in mammograms,” Med. Phys. 10.1118/1.2401667 34, 140–150 (2007). [DOI] [PubMed] [Google Scholar]
- Chang Y. H., Hardesty L. A., Hakim C. M., Chang T. S., Zheng B., Good W. F., and Gur D., “Knowledge-based computer-aided detection of masses on digitized mammograms: A preliminary assessment,” Med. Phys. 10.1118/1.1359250 28, 455–461 (2001). [DOI] [PubMed] [Google Scholar]
- Tourassi G. D., Vargas-Voracek R., Catarious J. D. M., and Floyd J. C. E., “Computer-assisted detection of mammographic masses: A template matching scheme based on mutual information,” Med. Phys. 10.1118/1.1589494 30, 2123–2130 (2003). [DOI] [PubMed] [Google Scholar]
- Bilska-Wolak A. O. and C. E.Floyd, Jr., “Tolerance to missing data using a likelihood ratio based classifier for computer-aided classification of breast cancer,” Phys. Med. Biol. 10.1088/0031-9155/49/18/003 49, 4219–4237 (2004). [DOI] [PubMed] [Google Scholar]
- Efron B. and Tibshirani R. J., An Introduction to the Bootstrap (Chapman and Hall, New York, 1993). [Google Scholar]
- Yates D., Moore D., and Starnes D., The Practice of Statistics (Freeman, San Francisco, 2006). [Google Scholar]
- Chakraborty D. P., “Maximum likelihood analysis of free-response receiver operating characteristic (FROC) data,” Med. Phys. 10.1118/1.596358 16, 561–568 (1989). [DOI] [PubMed] [Google Scholar]


