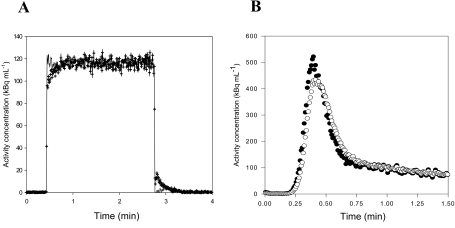
Figure 5.
Two examples of measured and dispersion-free blood TACs. (a) A measured square function (crosses) using the experimental setup in Fig. 1. The measurements are corrected for dispersion using the transmission-dispersion model (solid line), and the shape of the original square function is recovered. (b) Measured and dispersion-free blood TACs after an in vivo bolus injection of H215O [open circles are Co(t), closed circles are Ci(t)]. Data are shown up to 1 min where the effect of dispersion is most pronounced. The in vivo data were acquired for a project where we develop new models to estimate the hepatic perfusion (Ref. 31).

