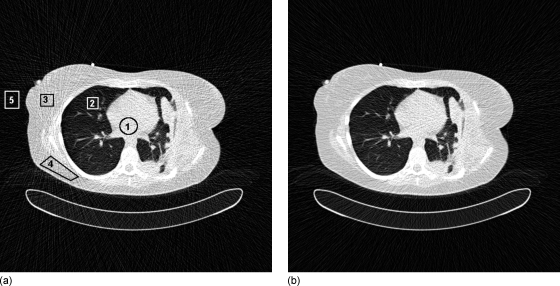
Figure 10.
Simulated images created by including a bowtie filter (left) and without one (right), with noise levels matched in the center of the image. Note appearance of noise levels in indicated regions. The percentage difference between two simulations is 1.8% in ROI No. 1 (center), 2.8% in ROI No. 2 (lung), 50.9% in ROI No. 3 (tissue-periphery), 44.6% in ROI No. 4 (tissue-periphery), and 28.3% ROI No. 5 (air-periphery).

