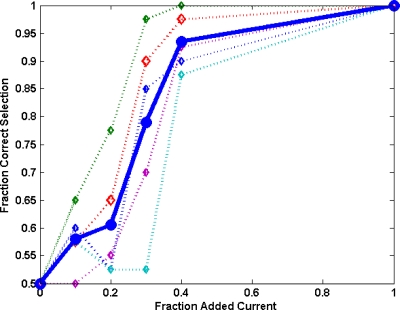
Figure 11.
Plot of fraction of low-dose images correctly identified vs the amount of additional current in one of the image pair. Data for five individual observers are presented with dotted lines, and solid line represent mean of all observers. The JND point (75% correct) for the mean of all observers is approximately 25% added current, while the JNDs for individual observers vary between 20% and 40% added current.

