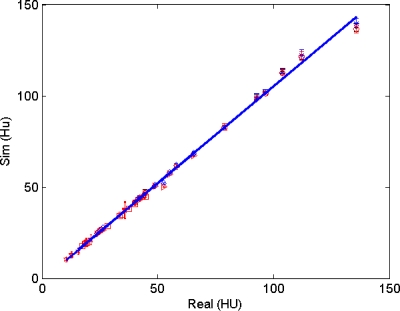
Figure 12.
Plot of real vs simulated image-domain noise (standard deviation in HU) for cadaver head (31 slices as shown in Fig. 3) and cylinder phantom (11 slices as shown in Fig. 4), with a total of more than 2000 ROI. The correlation factor of all data points is r=0.999 28; with r=0.998 49 for cylinder measurements, and r=0.9988 for cadaver head, respectively.

