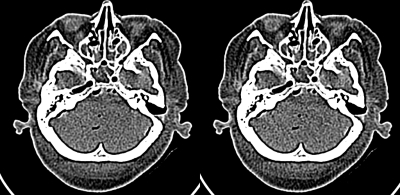
Figure 5.
Presentation image for two cadaver head slices used in JND study (simulated images were prepared from a 500-mAs cadaver head scan). Image on the right is simulated at 50 mAs current level, left image is simulated at 60 mAs current level, corresponding to 20% difference in dose level and a 10% difference in standard deviation.

