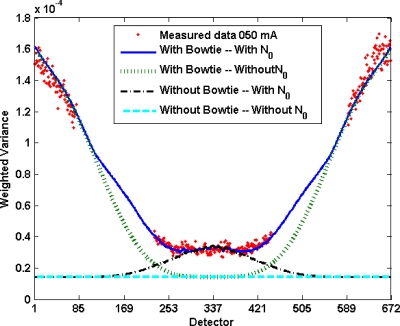
Figure 9.
The effect of various components on noise. Conditions are the same as Fig. 2, with solid line representing complete noise model fit to experimental data (dots). The dotted lines present the model with and without inclusion of bowtie filter profile and system noise. For uniform flux with no additive system noise, the model profile would be a constant for all detectors. The bowtie profile contributes rising noise away from the isocenter, while system noise increases noise primarily in the center of the cylinder.

