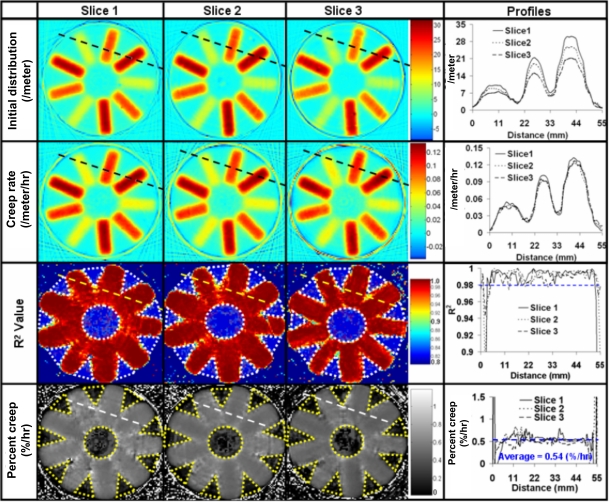
Figure 8.
Temporal stability—3D evaluation. The parameters of the linear regression model (see Sec. 2E2), C (initial distribution) and m (creep rate) are shown for three slices (similar to Fig. 4) in the top two rows. The third row shows the R2 value of the linear fit for the three slices. The percent creep was uniform in the irradiated regions of the dosimeter and was estimated from the model to be 0.54%∕h (fourth row). In the third and fourth row, the dotted regions were excluded from analysis because of uncertainty in measurement of low dose (<6% dose).

