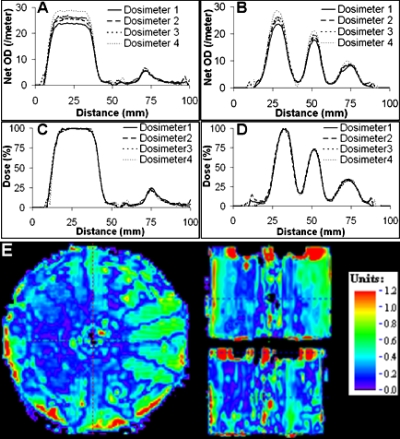
Figure 9.
Interdosimeter reproducibility—Profiles and representative gamma map in central slice. Profiles are along dotted lines in Fig. 7a. (a) and (b) Net profiles from four different dosimeters irradiated with the same treatment plan. (c) and (d) Relative dose profiles showed close agreement. (e) Representative 3D gamma comparison map (2% dose difference and 2 mm distance-to-agreement) between dose readout from dosimeter 1 and dosimeter 4.

