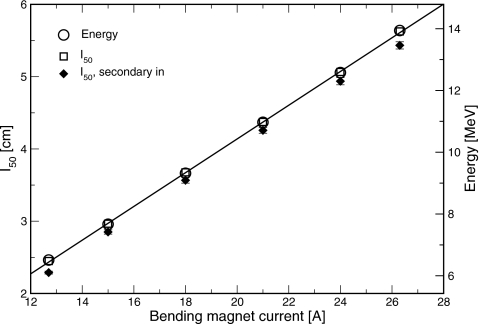
Figure 4.
Measured depth at which ionization falls to half its maximum value (left scale), and electron source energy as determined by Monte Carlo simulation (right scale) vs bending magnet current. Line is a fit of electron source energy derived from Monte Carlo vs bending magnet current. Simulated results used the thicker exit window geometry to match the measured results. Filled diamonds are the measured with the electron secondary scattering foil and monitor chamber in the beam path.

