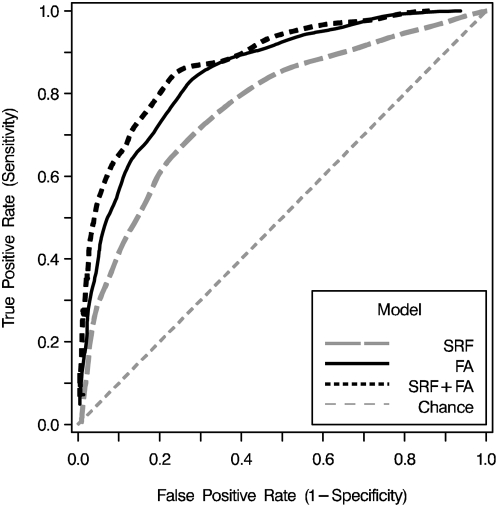
Figure 2. Discrimination between acute coronary syndrome cases and controls was assessed in the validation set (n = 450) with receiver operating characteristic curves.
Areas under the curves (c-statistics) were compared for the standard risk factors alone (c = 0.77; broken gray line), the RBC-FA model alone (c = 0.85; solid black line), and the combined model (c = 0.88; dashed black line). C-statistics for both models including FAs were significantly greater than the standard model but were not different from each other (Table 3; abbreviations as in Table 1).

