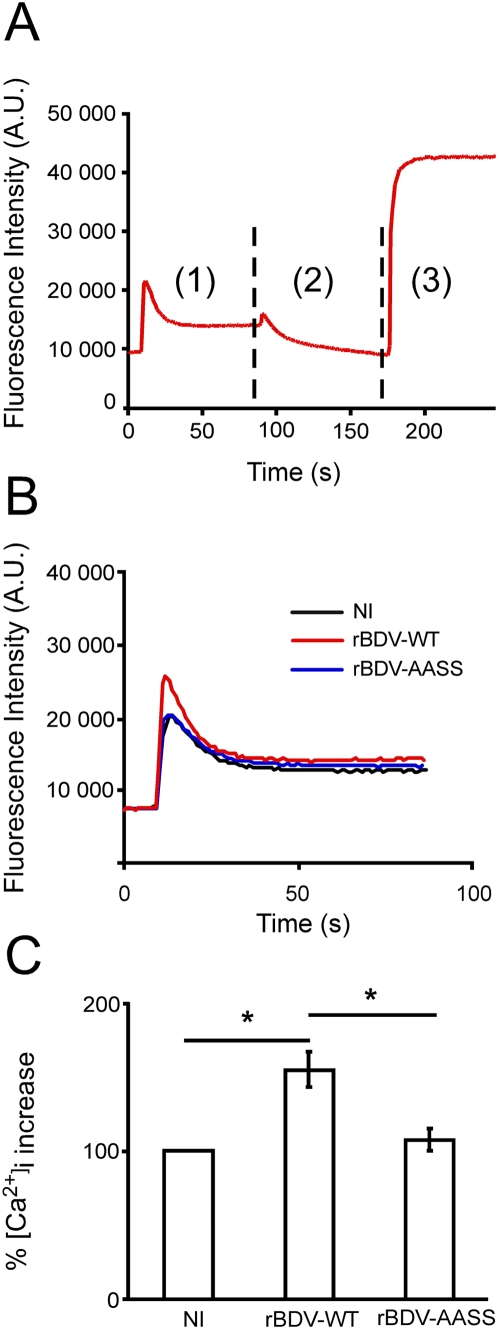
Figure 3. Calcium responses recorded from hippocampal neurons infected with the rBDV-WT and rBDV-AASS viruses.
(A) Representative example of a time-course measurement of free intracellular calcium by microspectrofluorimetry. Fluo-3 loaded neuronal cultures were recorded over a 250 second-period (1 measure per second) upon (1) exposure to 50 mM KCl; (2) treatment with thapsigargin/ionomycin in the presence of 10 µM EGTA to record the minimum fluorescence; (3) stimulation with 120 mM CaCl2 (a concentration sufficient to chelate EGTA), allowing the recording of the maximum fluorescence. (B) Representative example of the peak calcium responses following depolarization with 50 mM KCl of control neurons (NI) and neurons infected with rBDV-WT or rBDV-AASS viruses. Data were plotted on the same graph for comparison. (C) Quantitative analysis of peak calcium responses. In each case, recordings were performed on six separate wells, and data represent the mean of four independent experiments. [Ca2+]i increase was expressed as the increase in fluorescence signal after stimulation relative to the increase measured in NI neurons, which was set at 100%. *, p<0.05 by unpaired t-test.

