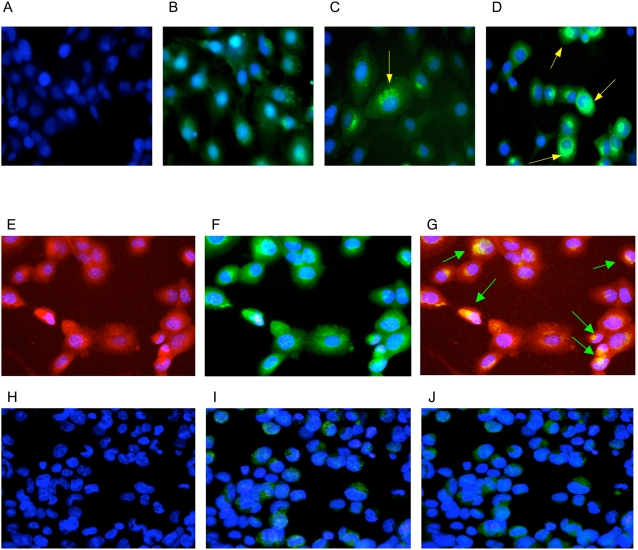
Figure 4. MCMV infection induced expression of renin in a dose dependent manner.
(A) Antibody control. Cells were stained at day 6 post CMV infection at multiplicity of infection (MOI) = 10, with a non-specific IgG as the first antibody. (B) Mock infection control (MOI = 0). Cells were stained at day 6 post mock infection by renin specific IgG as the first antibody. Renin was detected at a low level, with positive fine granules suffused in the cytoplasm, as As4.1 cells have a basal level expression of renin from Ren-1c locus. (C) MCMV infection in a low dose (MOI = 1). Cells were stained at day 6 post infection. Renin positive granules were big, around the nucleus. (D) MCMV infection in a high dose (MOI = 10). Cells were stained at day 6 post infection, and renin positive granules were bigger and denser, surrounding the nucleus. (E–G) Co-staining of MCMV and renin. (E) MCMV antigens were stained in red with TRITC by anti-MCMV antibodies. (F) Renin was stained in green with FTIC by anti-renin antibodies. (G) Overlay the staining of TRITC and FTIC to show MCMV and renin co-localization in cells. The yellow spots, representing the co-stain of MCMV antigen and renin, surrounded the nucleus (arrow pointed). (H–J) Controls of immunofluorescent staining. (H) Mock-infected cells stained by anti-MCMV antibodies with TRITC, no MCMV antigen was detected. (I) Mock-infected cells stained by anti-renin antibody with FTIC, only basal level expression of renin was detected. (J) Overlay of TRITC and FTIC in mock-infected cells, and no MCMV antigen signal was detected.

