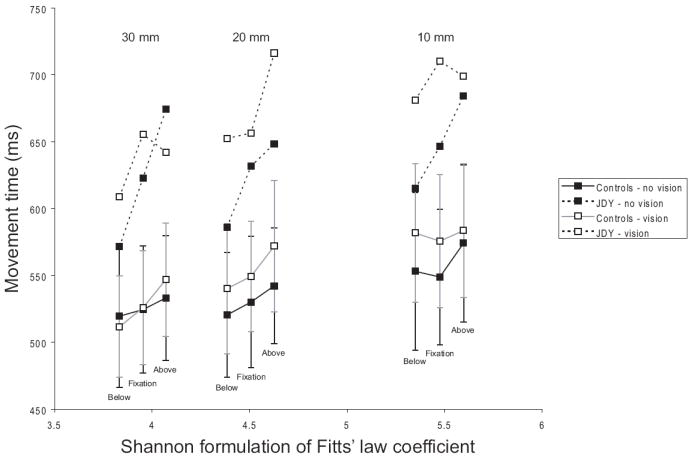
Figure 1.

Mean movement time for JDY and controls on each condition (by target size and target distance), labeled by the Shannon formulation of Fitts’ Law coefficient for each condition. Error bars represent one standard deviation. Target width is listed at the top of the figure, with target position (relative to fixation) also labeled.
