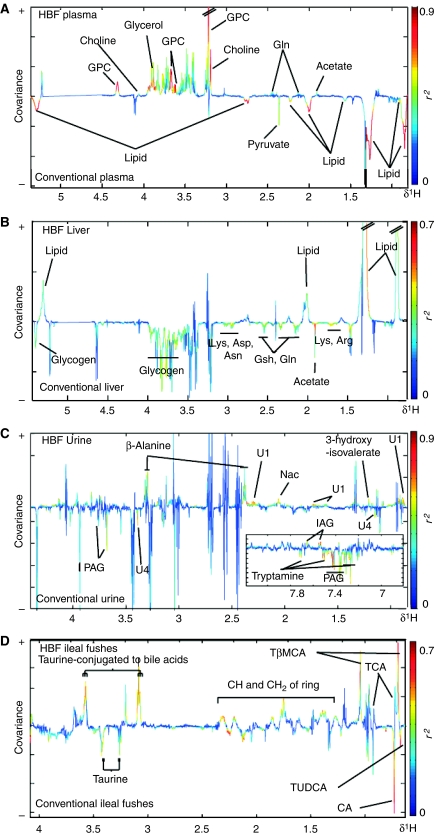
Figure 3.
O-PLS-DA coefficient plots derived from 1H NMR spectra. O-PLS-DA coefficient plots derived from 1H NMR CPMG spectra of plasma (A), 1H MAS NMR CPMG spectra of liver (B) and 1H NMR spectra of urine (C) and ileal flushes (D) indicating discrimination between conventional (negative) and HBF-colonized mice (positive). The O-PLS-DA coefficient plots are presented using a back-scaling transformation, as described previously (Cloarec et al, 2005b), which allows each variable to be plotted with a color code that relates to the significance of class discrimination as calculated from the correlation matrix. Arg, arginine; Asp, aspartate; Asn, asparagine; CA, cholic acid; Gln, glutamine; Gsh, glutathione; GPC, glycerophosphorylcholine; IAG, indoleacetylglycine; Lys, lysine; Nac, N-acetyl-glycoproteins; PAG, phenylacetylglycine; TCA, taurocholic acid; TβMCA, Tauro β muricholic acid; TUDCA, tauroursodeoxycholic acid.

