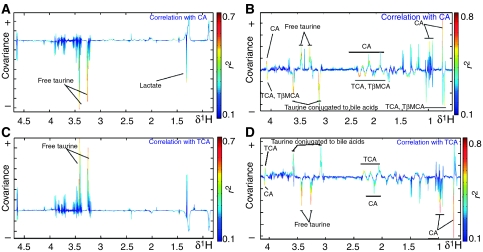
Figure 6.
Effect of major bile acids on organ-specific metabolic profiles. O-PLS coefficient plots describing correlation between 1H NMR spectra of 1H MAS NMR CPMG spectra of liver (A, C) and ileal flushes (B, D) and ileal concentrations of cholic acid (A, B) and taurocholic acid (C, D), as measured using UPLC–MS. The O-PLS coefficients plots are presented using a back-scaling transformation, as described previously (Cloarec et al, 2005b), which allows each variable to be plotted with a color code that relates to the significance of correlation as calculated from the correlation matrix. One predictive and two orthogonal components were calculated; the respective (Q2Y, R2X) are (55%, 39%), (47%, 37%), (36%, 44%) and (21%, 41%). CA, cholic acid; TCA, taurocholic acid.

