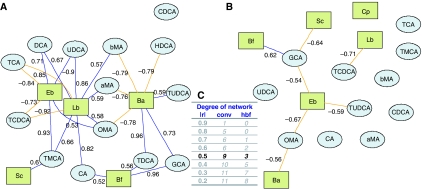
Figure 7.
Integration of bile acid and fecal flora correlations. The bipartite graphs were derived from correlations between fecal flora and bile acids in each group: conventional (A) or HBF (B). G=(N,E) specifies a graph G with N denoting the node set (bile acids) and E the edge set (correlation between bile acids, above a defined cutoff, that is, ∣r∣>0.5), which was defined using network degree statistics (C). Bile acids and fecal bacteria correspond to blue ellipse nodes and green rectangle nodes respectively. Edges are coded according to correlation value: positive and negative correlations are respectively displayed in blue and orange. aMA, α-muricholic acid; Ba, Bacteroides; Bf, Bifidobacteria; bMA, β-muricholic acid; CA, cholic acid; CDCA, chenodeoxycholic acid; Cp, Clostridium perfringens; DCA, deoxycholic acid; Eb, Enterobacteria; GCA, glycocholic acid; HCA, hyocholic acid; Lb, Lactobacillus; OMA, ω-muricholic acid; Sc, Staphylococcus; TCA, taurocholic acid; TCDCA, taurochenodeoxycholic acid; TDCA, taurodeoxycholic acid; TMCA, tauro-β-muricholic acid; TUDCA, tauroursocholic acid; UDCA, ursocholic acid.

