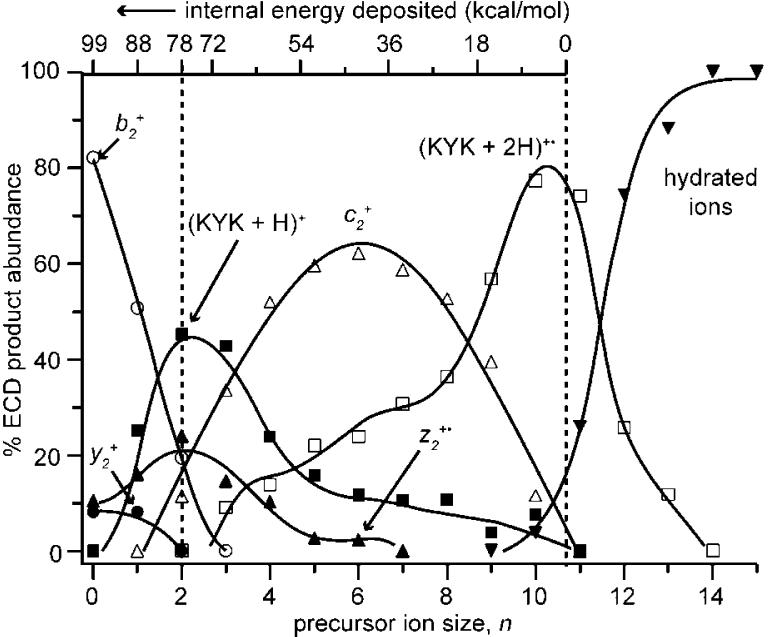
Figure 4.
Normalized abundances of dissociation products from intact reduced (KYK + 2H)(H2O)n 2+ and reduced ions that have lost a hydrogen atom, plotted as a function of n. Each curve is the sum of the indicated major product ion and its subsequent neutral losses (Scheme 1). The internal energy deposition scale, determined from the number of water molecules lost in ECD of these ions (see text), is used to establish an energy resolved breakdown curve for fragment ion formation; note that this scale is nonlinear above 78 kcal/mol.

