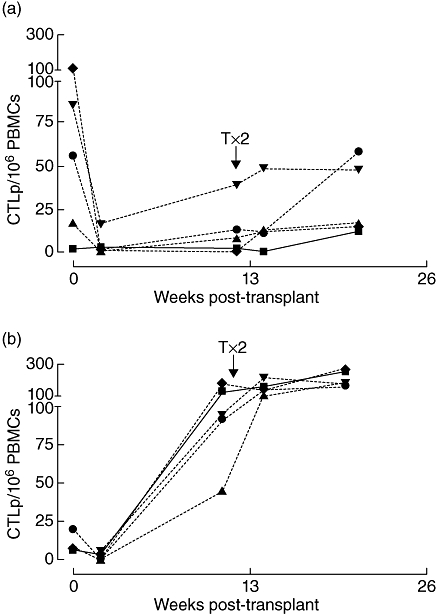
Fig. 4.

Different patterns of cytotoxic T lymphocyte precursor assay (CTLp) frequency development after first and second islet implantation. The single lines in each graph represent different human leucocyte antigen mismatch-specific stimulator–responder combinations. Straight lines depict combinations specific for the first transplant only, striped lines for the second transplant only and dotted lines for both. Interpretation of cellular alloreactive pattern per patient was performed based on all mismatch combinations and blinded from clinical outcome. Shown are representative examples of patients with low CTLp before and high after second transplant (a) or with high CTLp frequency both before and after (b).
