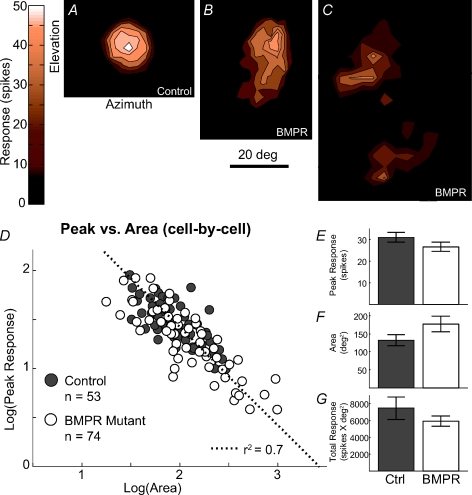
Figure 1. Abnormal RF shapes in BMPR mutants still obey response homeostasls.
A, B and C, example RFs in control (A) and BMPR mutant (B and C) mice. D, log–log plot of RF Peak Response vs. RF Area in all neurons from both littermate controls and BMPR mutant mice are well fitted (r2= 0.7) by a line of slope –1, demonstrating that the changes in RF shape do not prevent neurons in the SC from maintaining response homeostasis. E, F and G, summary histograms of average RF Peak Response, Area and Total Response in the control (grey columns) and BMPR (white columns) mutant mice. There is no significant difference among the mean values of the three parameters. However, there is a significant difference between the variance for RF Area and Peak Response (Levene test: P < 0.05).

