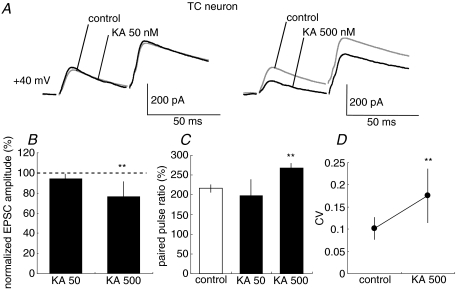
Figure 2. CT–TC EPSCs are decreased by KA application.
A, traces show NMDAR-EPSCs (Vh=+40 mV) in CT–TC synapses with the paired pulse stimulation at 50 ms interval in control and KA treatments (50 nm, left traces; 500 nm, right traces). Each trace is the average of traces evoked by five stimuli at 0.05 Hz. B, effects of 50 (KA 50) and 500 nm KA (KA 500) on amplitudes of CT–TC EPSCs (**P < 0.01, n= 20 and 20, respectively). C, summary of effects of 50 and 500 nm KA on paired-pulse ratio. D, summary of effects of 50 and 500 nm KA on coefficient of variation of EPSCs. Values are means ±s.d.

