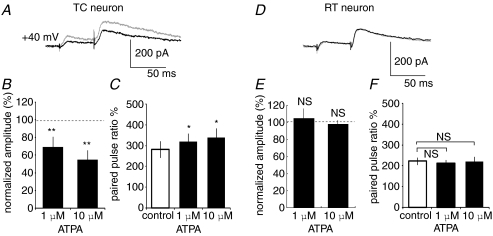
Figure 7. ATPA, an agonist of GluR5-containing KARs, mimics the effect of KA in CT–TC but not in CT–RT synapses.
A, CT–TC EPSCs with paired pulse stimulation at 50 ms interval in control (grey) and ATPA application (black line). Each trace is the average of traces evoked by five stimuli at 0.05 Hz. B, effects of ATPA on amplitudes of CT–TC EPSCs (mean ±s.d.; **P < 0.01, n= 10). C, summary of effects of ATPA on paired-pulse ratio in CT–TC EPSCs (mean ±s.d.; *P < 0.05, n= 7). D, CT–RT EPSCs with paired pulse stimulation at 50 ms intervals in control (grey) and ATPA application (black line). E, effects of ATPA on amplitudes of CT–RT EPSCs (NS, not significant; n= 10). F, summary of effects of ATPA on paired-pulse ratio in CT–RT EPSCs (NS, not significant; n= 7).

