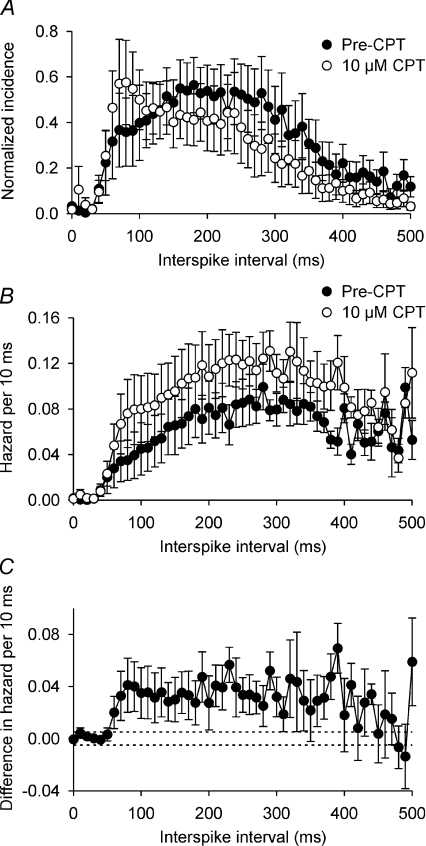
Figure 2. A1 receptor antagonism increases post-spike excitability during phasic bursts in vitro.
A, consensus mean interspike interval distribution (±s.e.m.) of the 6 supraoptic nucleus neurones in Fig. 1 before (•) and during (○) superfusion of 10 μm CPT. Distributions were normalized to the height of the mode for each neurone and averaged across the group. B, the mean hazard functions calculated from the interspike interval distributions used to generate the data shown in A, showing that 10 μm CPT (○) increased the probability of spike firing (hazard) after each spike. C, subtraction plot of the difference in hazard before and during 10 μm CPT superfusion, showing that the CPT-induced increase in the probability of spike firing was most prominent in the period ∼50–400 ms after each spike. The dashed lines show the 95% confidence interval of the difference in hazard plotted against the x-axis to illustrate the separation of the CPT-sensitive hazard from zero.

