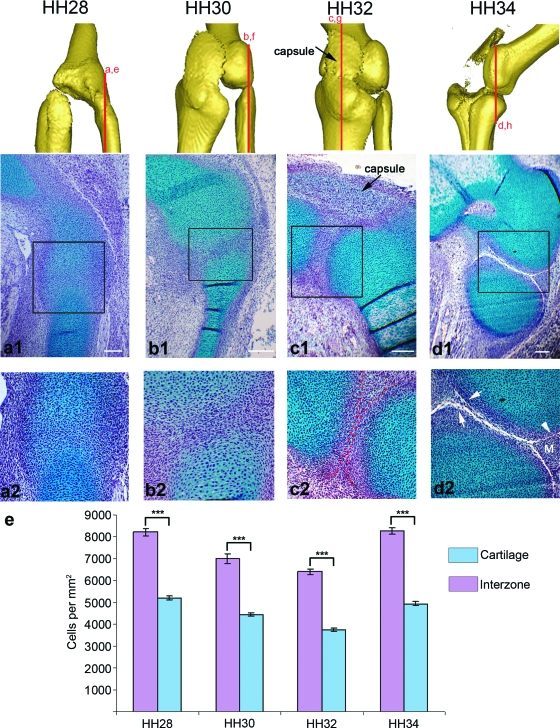
Fig. 3.
Cellular changes in the forming knee joint between stages HH28 and HH34. Longitudinal sections through the chick knee joint (stages indicated above each column) at both low magnification (a1–d1) and high magnification (a2–d2) focusing on the interzone with the approximate plane of section represented by red lines above. All sections are presented with the femur lying above either the presumptive fibula (a,b,d) or tibia (c) (Note: no difference was seen in the cellular architecture described on the fibula or tibia side of the joint at HH32). Regions stained blue (Alcian blue) are cartilaginous, while the nuclear counterstain haematoxylin is purple. Red dotted lines (c2) indicate the boundary of the chondrogenous layers. (e) The cartilaginous regions had a significantly lower (P ≤ 0.001) mean cell density than the intervening interzones at each stage (error bars represents SE) Arrowhead (d2) indicates joint cavity; arrows indicate artificially enlarged cavity; M, meniscus. Scale bars, 0.1 mm.

