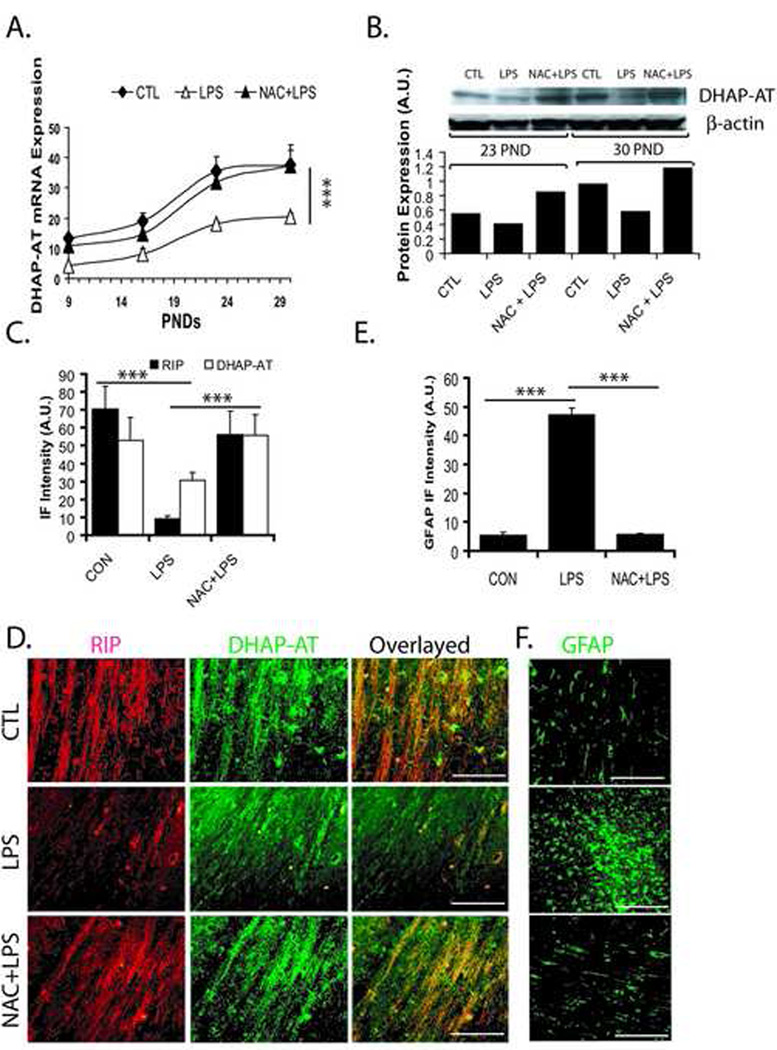
Figure 5. Systemic maternal injection of LPS at E18 alters the expression of DHAP-AT and GFAP in the rat postnatal brain.
Brains were collected from pups at different time points (PND 9, 16, 23 and 30) from the LPS, NAC + LPS, and control groups. Brains were fixed for immunohistochemistry studies or corpus callosum was cut and pooled from similarly treated animals for real-time PCR or Western blot analyses. Plot depicts the level of DHAP-AT transcripts in the corpus callosum of the brain at different PNDs (A). Representative Immunoblot autoradiogram (insert) and plot depict the level of DHAP-AT protein presented as arbitrary units (A.U.) in the brain at both PND 23 and 30 (B). Plot depicts levels of both RIP and DHAP-AT immunofluorescence in the corpus callosum of the brain at PND 23 (C). Representative sections show DHAP-AT immunostaining in the corpus callosum of the brain at PND 23 (D). Plot depicts level of GFAP immunofluorescence (E) and representative sections (F) depict GFAP immunostaining in the corpus callosum of the brain at PND 23. Data in plot are expressed as Mean ± SD from 3 independent experiments (A, C and E), but data in plot B represent the average mean of densitometeric analysis of two identical experiments. Statistical significance is indicated as *p<0.05 and ***p<0.001 versus LPS. Bar; 200 µM at original magnification 400x. Immunofluorescence intensity (IF) presented as arbitrary units (A.U.).

