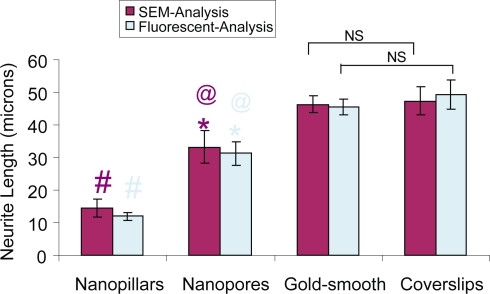
Figure 6.
Bar graph shows the mean neurite length obtained from cells on different types of substrates. Values reported are mean ± standard error; n = 60; #p < 0.05 (nanopillars compared with smooth controls); *p < 0.05 (nanopores compared with smooth controls); @p < 0.05 (nanopillars compared with nanopores).
Abbreviations: NS, not significant.

