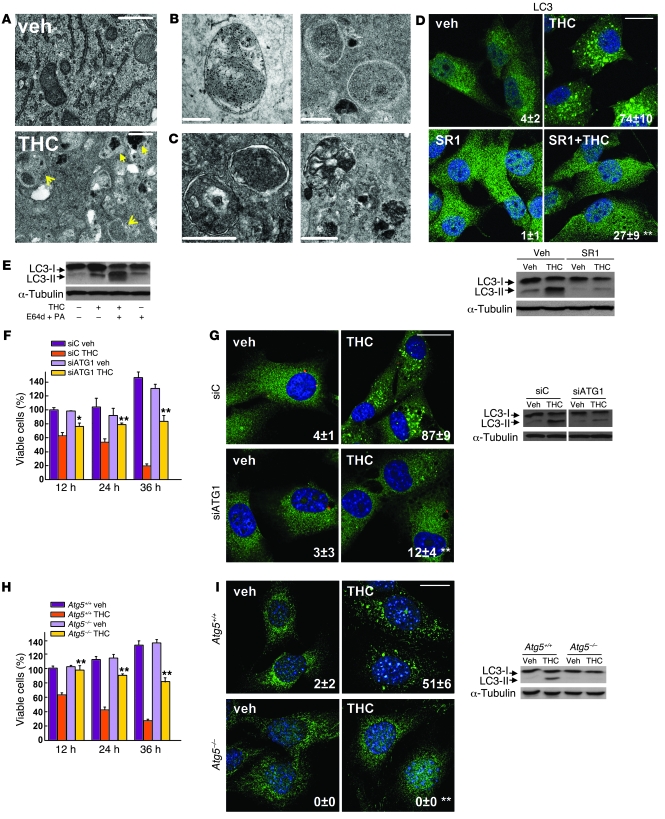
Figure 1. Inhibition of autophagy prevents THC-induced cancer cell death.
(A–C) Effect of THC on U87MG cell morphology. Representative electron microscopy photomicrographs are shown (6 h). Scale bars: 500 nm. Note the presence of early (A, open arrows, and B) and late (A, filled arrows, and C) autophagosomes in THC-treated but not vehicle-treated (veh-treated) cells. (D) Top: Effect of SR141716 (SR1; 1 μM) and THC on LC3 immunostaining (green) in U87MG cells (18 h; n = 3). The percentage of cells with LC3 dots relative to the total cell number is shown in the corner of each panel (mean ± SD). Scale bar: 20 μm. Bottom: Effect of SR1 and THC on LC3 lipidation in U87MG cells (18 h; n = 3). (E) Effect of E64d (10 μM) and pepstatin A (PA; 10 μg/ml) on THC-induced LC3 lipidation in U87MG cells (18 h; n = 3). (F and G) Effect of THC treatment and transfection with control siRNAs (siC) or ATG1-selective siRNAs (siATG1) on cell viability (F; mean ± SD; n = 3), LC3 immunostaining (G, left panels; 18 h; percentage of cells with LC3 dots relative to the total number of cells cotransfected with a red fluorescent control siRNA, mean ± SD; n = 3; scale bar: 20 μm), and LC3 lipidation (G, right panel; 18 h; n = 3) in U87MG cells. (H and I) Effect of THC on cell viability (H; mean ± SD; n = 3), LC3 immunostaining (I, left panels; 18 h; percentage of cells with LC3 dots relative to the total cell number, mean ± SD; n = 3; scale bar: 20 μm), and LC3 lipidation (I, right panel; 18 h; n = 3) in Atg5+/+ and Atg5–/– RasV12/T-large antigen MEFs. *P < 0.05 and **P < 0.01 compared with THC-treated U87MG (D) and Atg5+/+ (H and I) cells and compared with siC-transfected, THC-treated U87MG cells (F and G). THC concentration was 6 μM.

