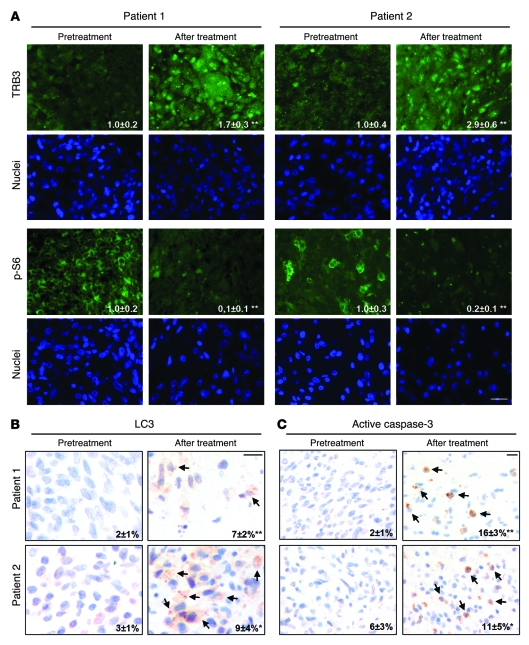
Figure 8. THC administration promotes autophagy in glioblastomas of 2 patients.
Analysis of different parameters in 2 patients with glioblastoma multiforme before and after intracranial THC treatment (it was estimated that doses of 6–10 μM were reached at the site of administration). (A) TRB3 and p-S6 immunostaining. Representative photomicrographs are shown. Numbers indicate the TRB3- or p-S6–stained area normalized to the total number of nuclei in each section (mean fold change ± SD) relative to the corresponding pre-treatment sample. Fifteen sections were counted for each tumor and each condition (before and after treatment). Scale bar: 50 μm. (B) Representative photomicrographs of LC3 diaminobenzidine immunostaining. The mean percentage of cells with LC3 dots ± SD relative to the total number of nuclei in each section is noted in the corner of each panel. Ten sections were counted from each biopsy for each condition. Arrows point to cells with LC3 dots. Scale bar: 20 μm. (C) Representative photomicrographs of active caspase-3 diaminobenzidine immunostaining. Numbers indicate the percentage of cells with active caspase-3 staining ± SD relative to the total number of nuclei in each section. Ten sections were counted from each biopsy for each condition. Arrows point to cells with active caspase-3 staining. Scale bar: 20 μm. *P < 0.05 and **P < 0.01 compared with before treatment.

