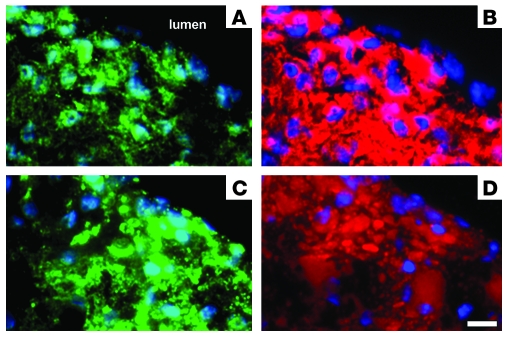
Figure 8. Accumulation of quantum dots in macrophages and foam cells of atherosclerotic lesions in vivo.
Quantum dots (2 nmol) were injected into an Apoe-knockout mouse. After 24 hours, the aorta was harvested, and the aortic arch was processed for fluorescence microscopy. Nuclei (blue) and quantum dots (green) in the intima were first imaged (A and C). Then the same respective tissue sections were either immunolabeled with anti-CD68 to detect macrophages (red) (B) or stained with oil red O to demonstrate lipid in foam cells (red) (D). Quantum dots are only visualized in A and C because they are lost from the tissue sections during subsequent oil red O lipid staining and macrophage immunostaining. These images show localization of quantum dots within macrophages and foam cells of atherosclerotic lesions. Scale bar: 2 μm.

