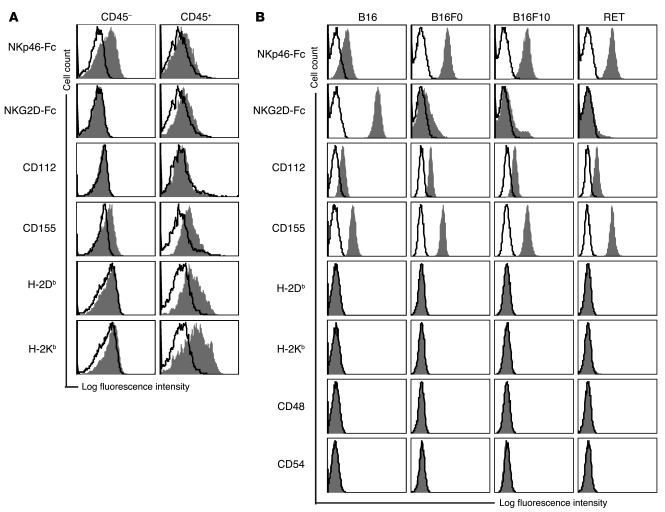
Figure 2. Expression of ligands for NKp46 and DNAM-1 on murine melanoma cells.
(A) Expression of the indicated ligands (filled histograms) relative to background staining determined by isotype-matched controls (open histograms) on single-cell suspensions prepared from tumor lesions freshly explanted from RET transgenic mice. CD45 expression was used to discriminate tumor infiltrating lymphocytes (CD45+) from the melanoma cells (CD45–). Histograms are representative of 4 individual mice that displayed similar stages of disease progression as judged by tumor size. (B) Expression of the indicated ligands (filled histograms) relative to background staining determined by isotype-matched controls (open histograms) on melanoma cell lines. Histograms are representative of 2–5 independent experiments.

