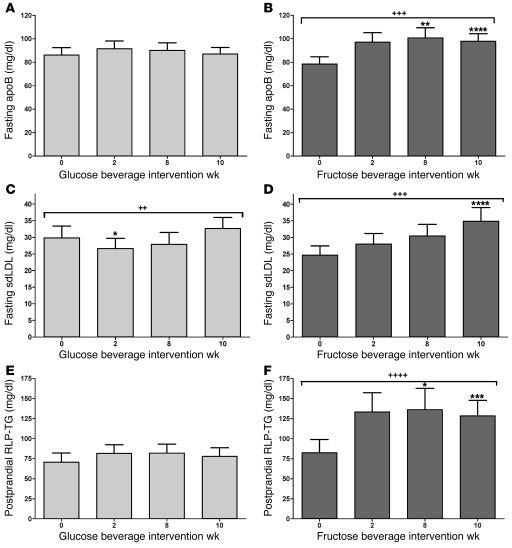
Figure 3. apoB, sdLDL, and RLP-TG.
Fasting apoB concentrations in subjects before and after 2, 8, and 10 weeks of consuming glucose-sweetened beverages (A) or fructose-sweetened beverages (B). Fasting sdLDL concentrations in subjects before and after 2, 8, and 10 weeks of consuming glucose-sweetened beverages (C) or fructose-sweetened beverages (D). Postprandial RLP-TG concentrations in subjects before and after 2, 8, and 10 weeks of consuming glucose-sweetened beverages (E) or fructose-sweetened beverages (F). ++P < 0.01; +++P < 0.001; ++++P < 0.0001, PROC MIXED 3-factor RM ANOVA (C and D) with prior day’s energy intake covariable (A, B, E, and F). *P < 0.05; **P < 0.01; ***P < 0.001; ****P < 0.0001, Tukey’s multiple comparison test vs. 0 weeks. Glucose, n = 15; fructose, n = 17. Data represent mean ± SEM.

