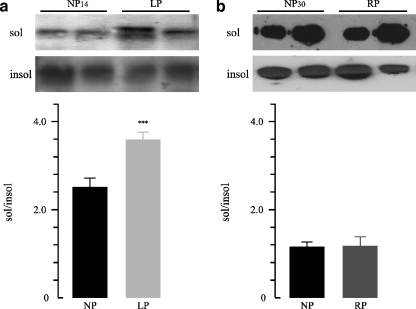
Fig. 2.
Representative Western blot and densitometry of TritonX100-soluble and -insoluble Na+/K+-ATPase in outer stripe of the outer medulla (OSOM) a OSOM renal tissue obtained from control 14 days (NP14) group compared to low protein diet group (LP). b OSOM renal tissue obtained from control 30 days (NP30) group compared to recovery group (RP; n = 12). Increased sol/insol Na+/K+-ATPase ratio was demonstrated in OSOM from LP compared to NP14, ***p < 0.01. Data are shown as mean ± SEM

