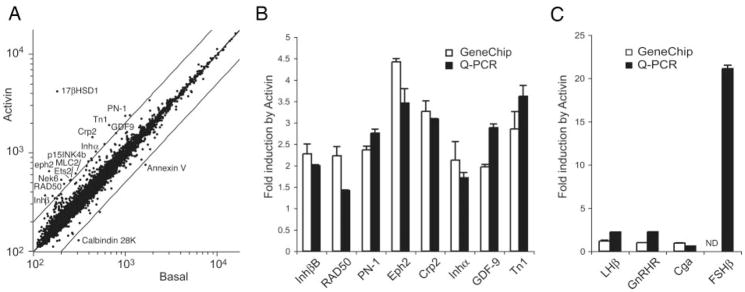
Fig. 1. Gene Expression Profiling in LβT2 Cells in Response to Activin.
Cells were treated with 25 ng/ml activin or vehicle for 24 h. Total RNA was profiled on Affymetrix U74Av2 chips. A, Scatterplot of expression levels from activin-treated (y-axis) or basal cells (x-axis). Data are normalized using CORGON and log transformed. Parallel lines indicate 2-fold changes. Units are relative fluorescence. B, Validation of selected genes by Q-PCR. Graph shows fold change with activin treatment as measured by microarray (open bars) or Q-PCR (black bars). RNAs are from four independent experiments. C, Induction of gonadotropin and GnRH-receptor genes by activin by microarray (open bars) or Q-PCR (black bars). Gene symbols are consistent with National Center for Biotechnology Information Entrez Gene nomenclature. ND, Not detectable.

