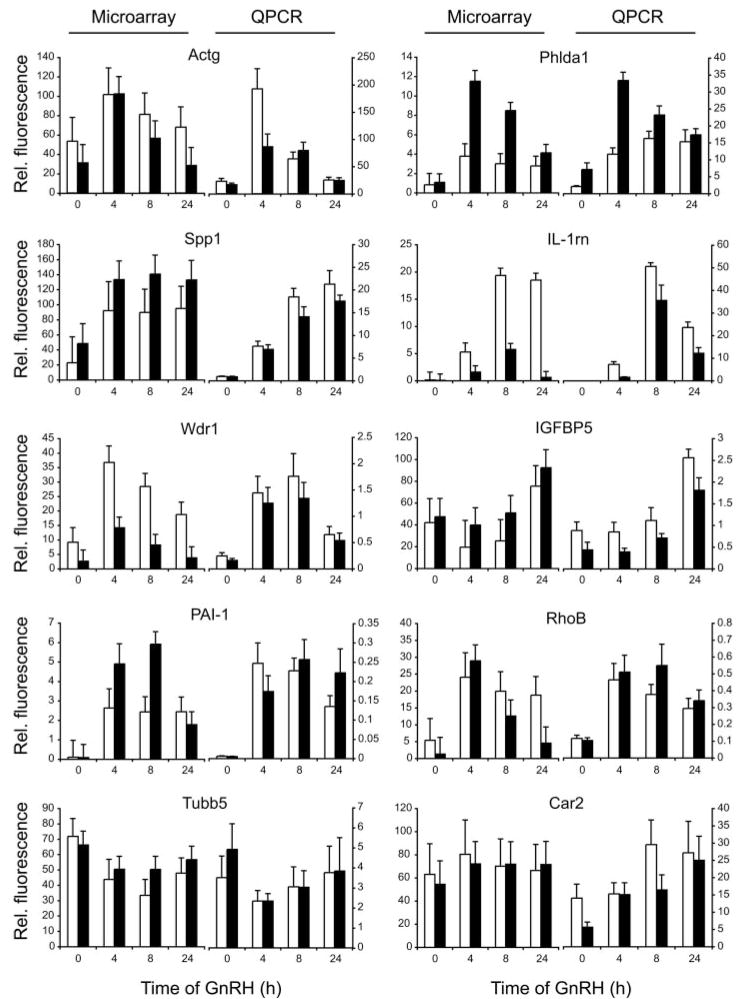
Fig. 4. Validation of Microarray Data by Q-PCR.
Ten genes were chosen from the list of differentially regulated genes for validation on RNA from four independent experiments. Each Q-PCR measurement was made in triplicate. Data are standardized to the ATPase6d1 gene (vacuolar ATP synthase subunit d1 or physophilin). Left-hand panel for each gene shows the microarray results; right-hand panel shows the Q-PCR data. Black bars (■) denote activin-treated cells; open bars (□) denote untreated cells. Vertical axis shows relative fluorescence units; horizontal axis shows time of GnRH treatment.

