
Fig. 7. GnRH Represses Mitochondrial Function.
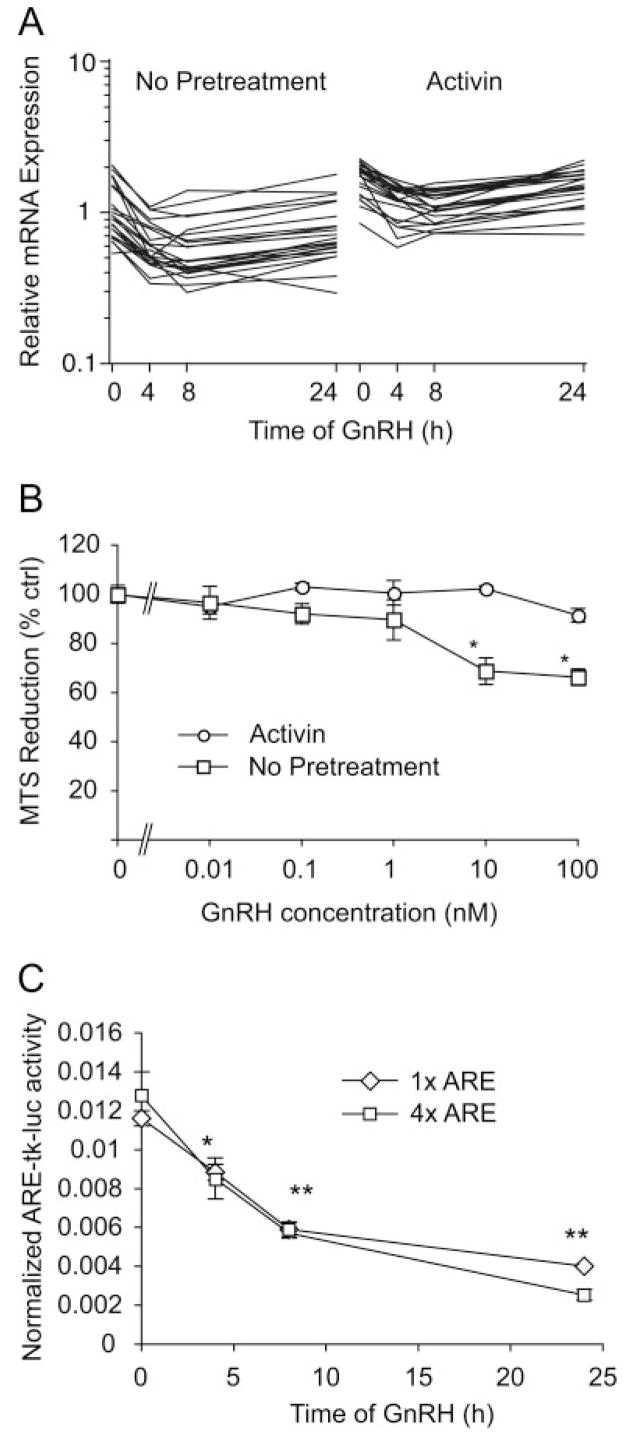
A, Expression profiles of mitochondrial genes that were found to be repressed by GnRH. Left panel shows expression data in cell not treated with activin; right panel shows data in activin-treated cells. Data are log-transformed, median-normalized MAS data. Horizontal axis shows time of GnRH treatment; vertical axis shows relative fluorescence signal. B, Mitochondrial activity is repressed by GnRH. Cells were treated with activin for vehicle for 24 h and then with increasing doses of GnRH for a further 24 h. Mitochondrial activity was measured with the redox-sensitive dye MTS by the increase in absorbance at 490 nm. Experiment was performed in quadruplicate on three independent occasions. C, Cells were transfected with 1xARE-tk-luc or 4xARE-tk-luc reporter genes and a β-galactosidase control plasmid. After transfection, cells were treated with 100 nM GnRH for increasing times. Luciferase activity is normalized for the cotransfected β-galactosidase activity. The experiment was repeated four times in duplicate. The results show the mean ± SEM; *, P < 0.05; **, P < 0.01 vs. zero time control. ARE, Antioxidant response element.