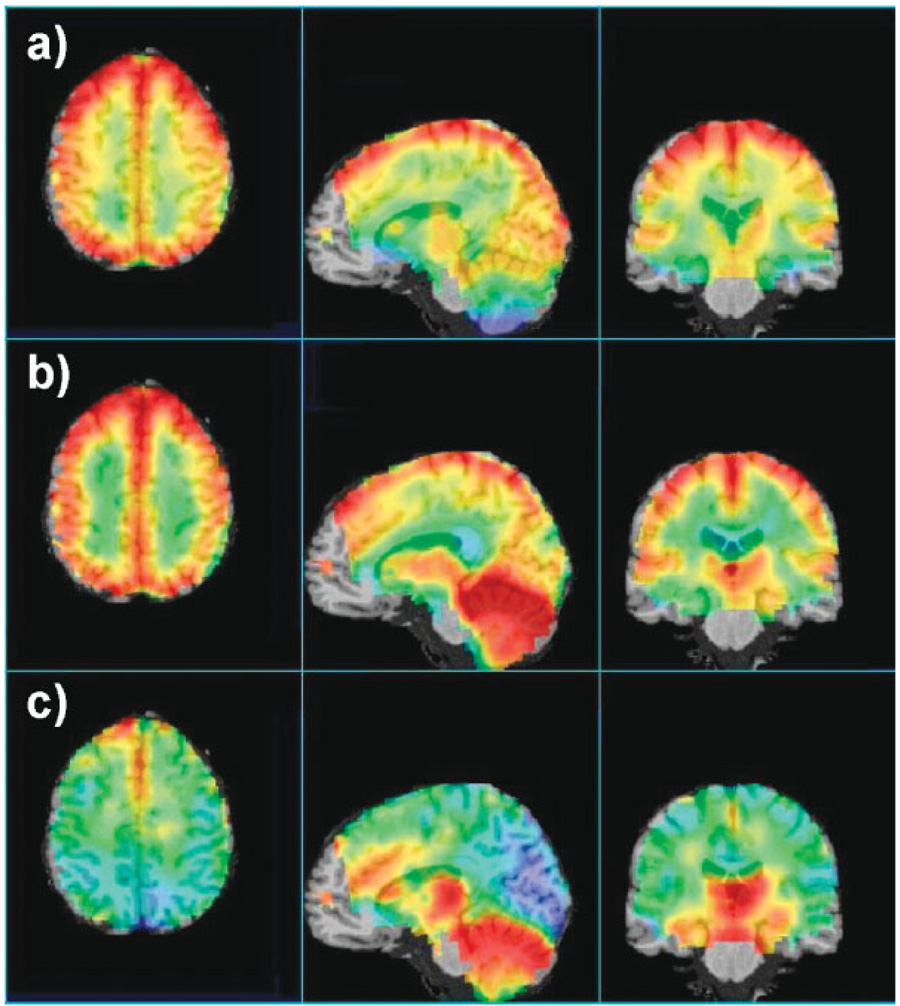
Figure 4.
Maps of the average metabolite levels from 14 subjects selected from the three-dimensional volume, showing the (a) NAA, (b) creatine and (c) choline distributions along three orthogonal directions. The metabolite images were CSF corrected and intensity normalized, and are shown in color superimposed on the reference MRI, with red indicating high data values, yellow intermediate and green–blue low. The color scales were adjusted separately for the best visualization of each set of metabolite images

