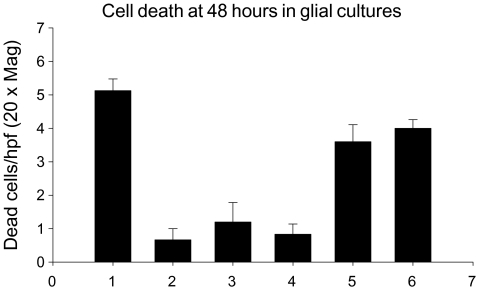
Fig. 1.
The effect of EPF and fetal calf serum (FCS) on cell death in mixed glial cultures using trypan blue exclusion. The percentage of dead cells is shown on the y-axis. The bars represent 1) DMEM alone, 2) DMEM + 10% FCS, 3) DMEM + 800 nM EPF, 4) DMEM + 80 nM EPF, 5) DMEM + 8 nM EPF, 6) DMEM + 800 pM EPF

