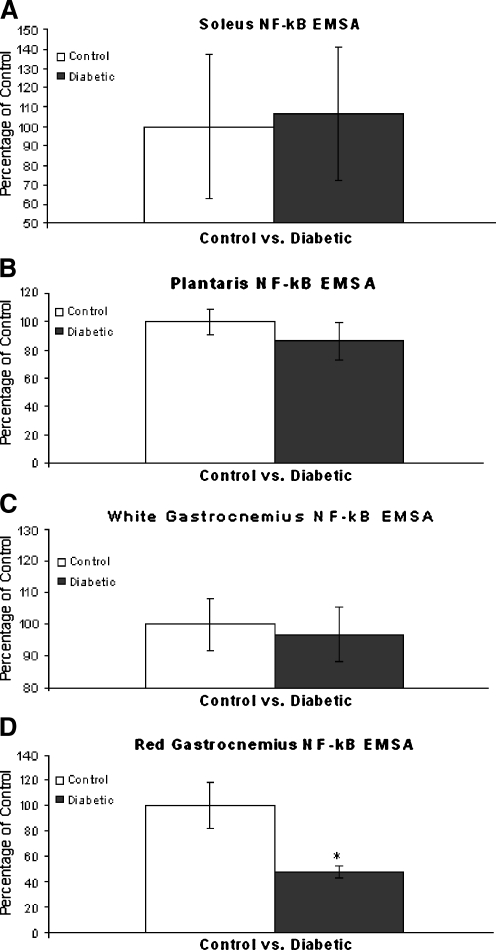
Fig. 4.
Graphical Illustration of NF-κB Activation. Panel a Representation of NF-κB binding in SOL muscles expressed as percentage of control ± SEM. No significant difference between control and diabetic animals was observed. Panel b Representation of NF-κB binding in PL muscles expressed as percentage of control ± SEM. No significant difference between control and diabetic animals was observed. Panel c Representation of NF-κB binding in WG muscles expressed as percentage of control ± SEM. No significant difference between control and diabetic animals was observed. Panel d Representation of NF-κB binding in RG muscles expressed as percentage of control ± SEM. NF-κB binding was significant reduced (P < 0.05) in RG tissues of diabetic animals. *Significantly different (P < 0.05) from control animals

