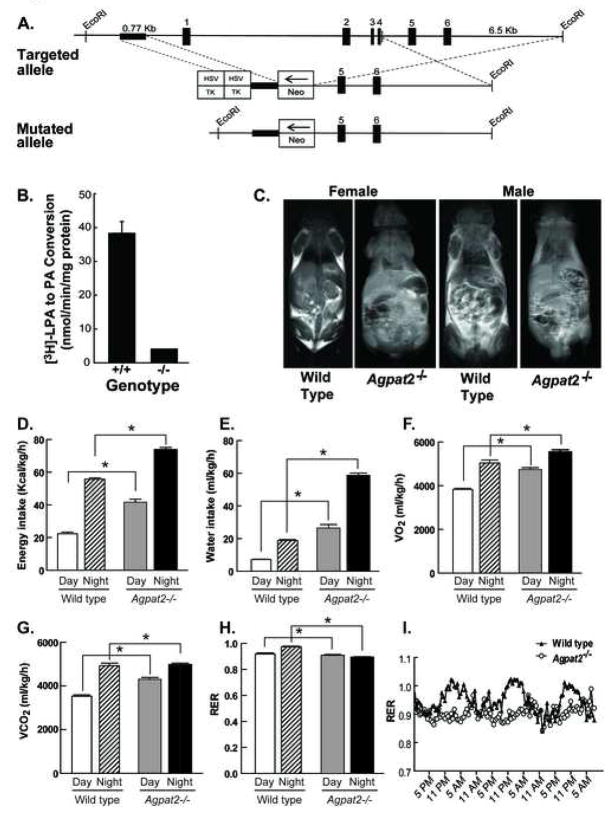
Figure 1. Strategy to disrupt Agpat2 in mice. Agpat2−/− mice have markedly reduced total hepatic AGPAT activity, complete lack of adipose tissue and abnormal energy metabolism.
(A) The map of the wild type allele is shown for exons 1–6 of Agpat2. The genomic sequence spanning a portion of the promoter and exons 1–4 were replaced with the neomycin-resistance cassette (NEO). Abbreviation: Herpes simplex virus thymidine kinase, HSC-TK
(B) Total AGPAT activity in the liver homogenates of the Agpat2−/− mice revealed significantly reduced activity (10% of that measured in wild type mouse livers). Livers from 6 Agpat2−/− mice and 6 wild type mice were studied.
(C) Magnetic resonance imaging of the male and female wild type and Agpat2−/− mice. Coronal sections were obtained on the whole body mid-section for 3 males and 3 females Agpat2−/− and 3 male and 3 female wild type mice. The wild type mice show adipose tissue in the subcutaneous and intra-abdominal regions as areas of increased signal intensity on T-1 weighted images. The Agpat2−/− mice in contrast have no adipose tissue.
(D) energy intake, (E) water intake, (F) O2 consumption (G) CO2 production, (H) Respiratory Exchange Ratio (RER) and (I) RER time course in wild type (unfilled bars and hatched bars for the day and night data, respectively) and Agpat2−/− mice (filled gray and black bars for the day and night data, respectively). The data are normalized to lean body mass, which was 5.7% greater in Agpat2−/− mice. Bars represent the mean and the whiskers represent SEM. * indicates p<0.05 in the comparison between the two genotypes for the same period (day or night).

