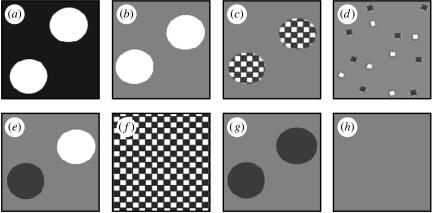
Figure 3.
Main visual stimuli for experiment 2 (second order) shown as units of the whole background (see figure 2b for example of whole stimulus). Where stimuli include circles, then the area, number and configuration remain constant between stimuli. (a) White circles on black background: positive control to ensure circle area produced strong Disruptive response. (b) White circles on grey background: ‘working contrast’ positive control. (c) Three millimetre chequerboard-filled white circles having overall identical power output as the grey background (measured by average pixel value). (d) Three millimetre individual ‘checks’ scattered across same grey in the same numbers as make up the circles in (c), so as to maintain power output across whole stimulus. (e) Equal number of black and white circles to retain same overall power. (f) Uniform 3 mm chequerboard. (g) Black circles on grey: negative control of (b). (h) Uniform grey: negative control. Stimuli (a–f) were also tested at 50 and 25% nominal contrast (not shown).

