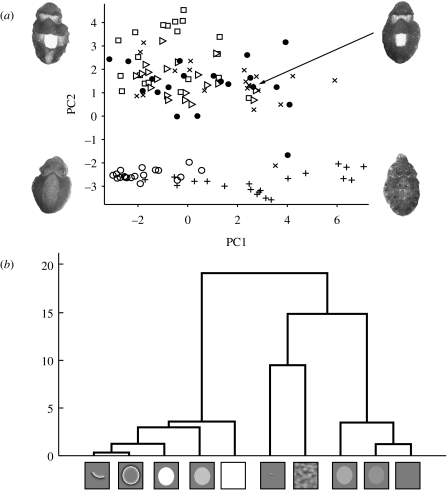
Figure 5.
Results from experiment 1. (a) Plot of individual responses on PCs 1 and 2 for six of the stimuli. Cuttlefish images show the type of body pattern typical to highly positive and negative scores, and intermediate response for both PCs. Here, it can be seen how the PC scores can be used to characterize and cluster responses (squares, white circle on black; triangles, white circle on grey; filled circles, high-passed full circle; crosses, high-passed quarter circle; pluses, phase randomized; open circles, uniform grey). (b) Hierarchical cluster tree showing statistical relationship between stimuli responses, as determined by MANOVA for PCs 1–4, showing two major clades with Disruptive-type responses on the left and Mottle/Uniform responses on the right. Quarter sections of high-passed circles, full high-pass circles and white circles on grey show little statistical distance between them.

