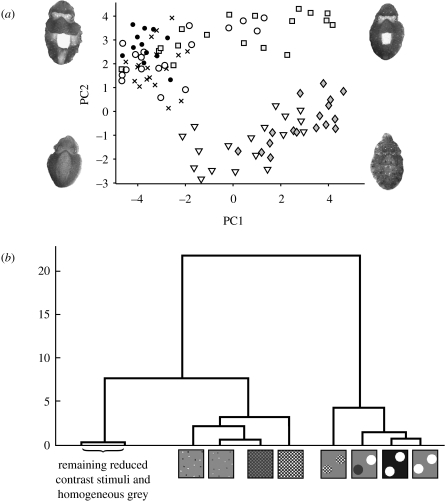
Figure 6.
Results from experiment 2. (a) Scores of responses to six experimental stimuli showing two main clusters of data points, one characterized by positive PC1 and negative PC2 scores (scattered 3 mm squares, diamonds; and 3 mm chequerboard, down triangles), and the other by negative PC1 and positive PC2 scores (white circles on black, filled circles; white circles on grey, open circles; and mixed black/white circles on grey, crosses). The responses to the second-order stimuli (‘objects’ formed from 3 mm checks on grey, squares) are not closely clustered with other groups and often have positive scores on both PC1 and 2. Images of cuttlefish illustrate the response typical to that area of the plot. (b) Hierarchical tree illustrating the statistical relationships of the responses to the stimuli as determined by MANOVA for PCs 1–3. This shows that the second-order stimulus elicits a response more similar to that of whole white circles than to 3 mm checks, which are separated by a large distance. Most reduced contrast stimuli resulted in responses that were closely related to responses to uniform grey, and these have been grouped here for ease of interpretation.

