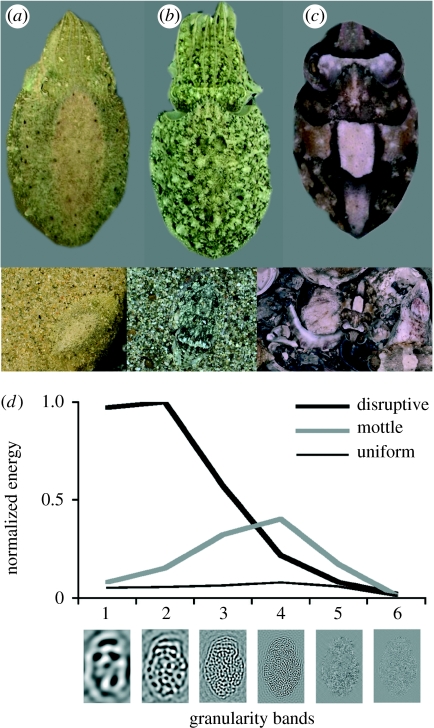
Figure 1.
(a–c) Representative uniform, mottle and disruptive patterns, respectively, in the cuttlefish Sepia officinalis. (d) The granularity analysis; see text §4 for details. The three spectra shown are typical of uniform, mottle and disruptive patterns (modified from Barbosa et al. 2008b).

