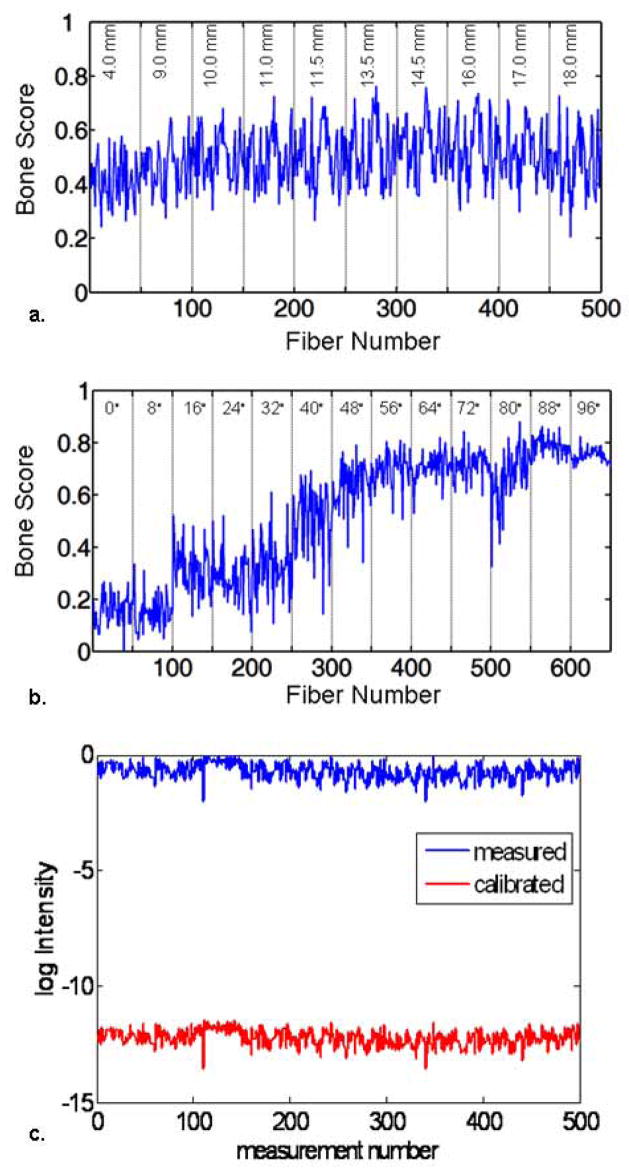
Fig. 5.
(a) Bone scores computed from reflectance measurements. (b) Bone scores computed from transmission measurements. The score plots indicate the correlation between the spectra obtained at each collection fiber and the bone spectra. (c) The bone scores were calibrated before the reconstruction using a scaling factor obtained from the phantom data, which compensated for the misfit between the FEM model and the measured data.

