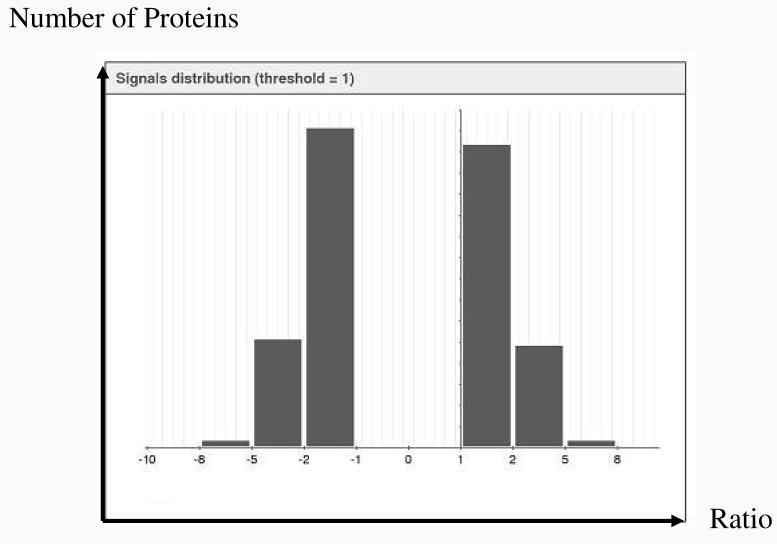
Figure 6.
Distribution of the protein abundance ratio between MDAH-2774 and TOV-112D on log2 scale. 828 differentially expressed proteins with fold changes larger than 2 based on normalized spectral count data were used to generate this histogram. Horizontal axis shows the ratio of the relative abundance between filtered proteins from MDAH and TOV on log2 scale. Vertical axis shows the number of proteins within each column.

