
Figure 2.
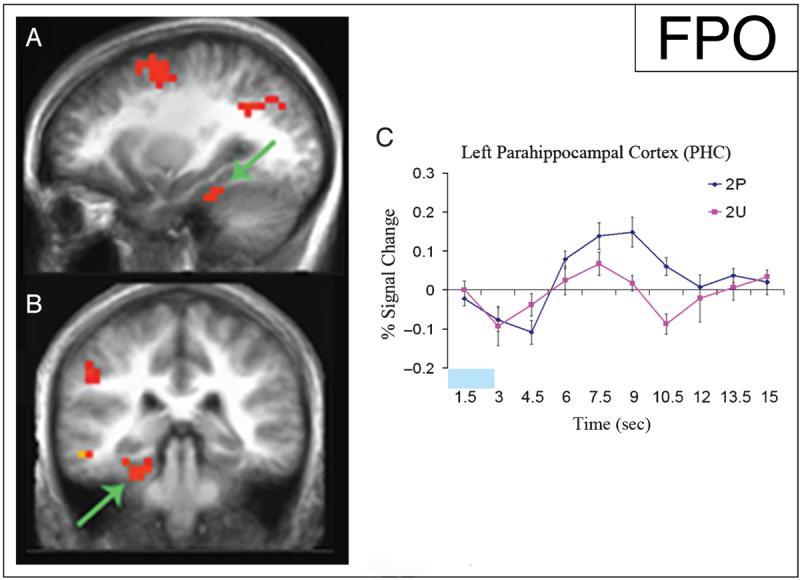
Increased activity in the left PHC during the encoding of the second paired (2P) stimuli versus the second unpaired (2U) stimuli. Statistical activation maps illustrating greater activation (p < .01) during the encoding of 2P versus 2U stimuli are superimposed on sagittal (A) and coronal (B) slices of mean anatomical scan images across all 13 subjects; arrows indicate the left PHC cluster used for time-course analysis. (C) Time course of activity in the left PHC beginning with the onset of 2P stimuli (blue) and 2U stimuli (pink) demonstrates activity during item encoding, with increased activity during associative encoding. The time of stimulus presentation is represented by the light blue block. The y-axis represents percent signal change, the x-axis is time in seconds (sec), and the error bars represent the standard error of the mean.