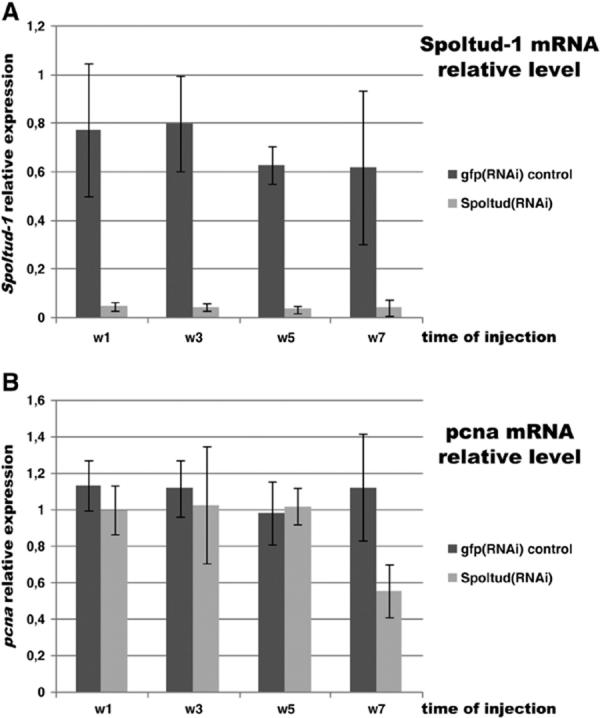
Fig. 6.

Spoltud-1 and pcna mRNA expression levels in Spoltud-1(RNAi) animals. (A) Spoltud-1 mRNA relative levels by means of real time PCR during RNAi treatment, showing the efficiency of the dsRNA injections. (B) pcna mRNA levels during RNAi treatment. Pcna levels in Spoltud-1(RNAi) animals are not significantly different from control animals during the first 5 weeks. In the seventh week there is a decrease in pcna mRNA levels. w1, week 1; w3, week 3; w5, week 5; w7, week 7.
