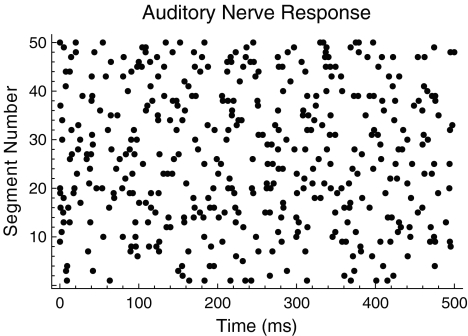
FIG. 1.
The irregular response of a mammalian auditory nerve fiber to high-rate electrical stimulation. A dot raster plot showing the spike times of a mammalian auditory nerve fiber when stimulated by a 5-kHz electrical pulse train. Dots indicate the time of occurrence of a spike within a 500-ms time window. Responses to 50 contiguous segments are stacked vertically in the figure. Auditory nerve data were collected by Litvak et al. (2003a).

