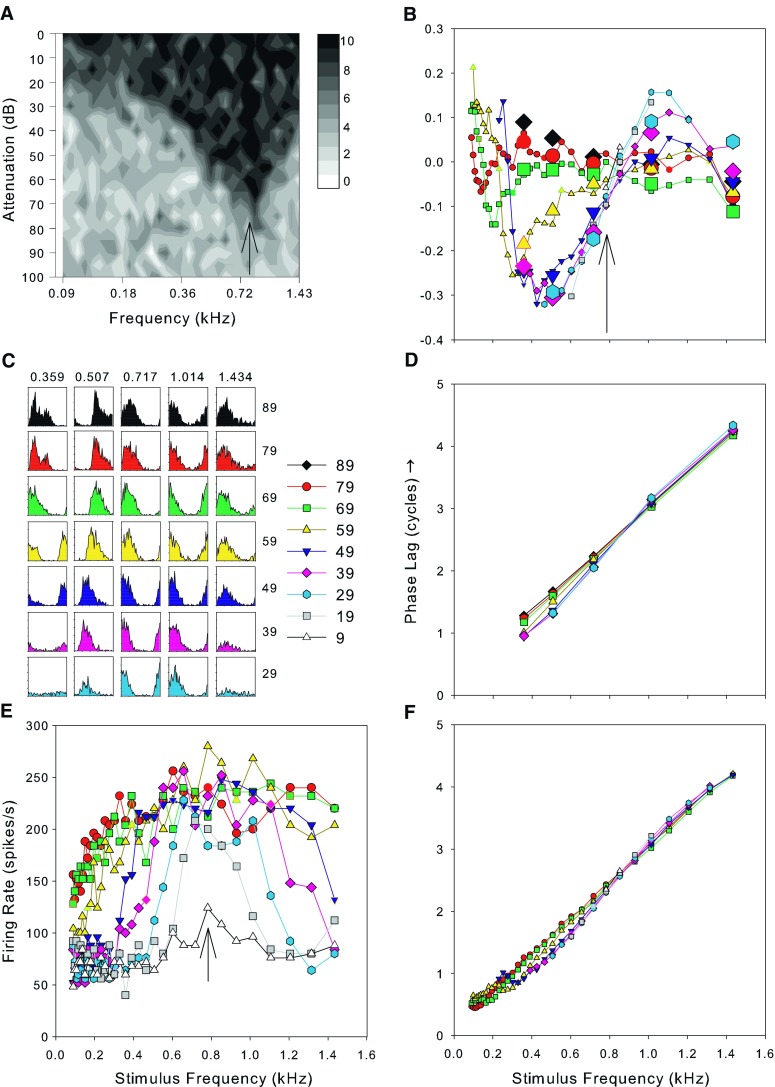
FIG. 1.

A The frequency response area as a grayscale plot. The CF of this fiber was 0.717 kHz and its spontaneous rate was 58.5 spikes/s. The sound levels are shown as attenuations: The mean maximum sound level over the range of this response area was 91 dB SPL with a standard deviation of 1.7 dB. B The variation of the compensated phase of phase locking as a function of stimulus frequency and sound level (compensated by subtracting the best fitting linear function to the phase curve measured from the FRA derived data at 79 dB SPL). C Period histograms from 50 repeats of tones at half-octave intervals (frequencies across the top, sound levels in dB SPL at the right). D The variation of raw phase values obtained from the histograms in C after unwrapping the phase. E The mean discharge rate as a function of the level and frequency of pure tones (frequency response area). F. The unwrapped raw phase data obtained from period histograms computed from the same data as E. Symbols used in B and D–F represent data for sound levels from 9–89 dB SPL as indicated in the key next to C. The arrow in A, B, and E indicated the frequency of the peak at the lowest sound level in E.
